


|
Selecting Variables
Variables are the columns of data used by visualizations. For example, if you have a database of sales information broken down by product, you might associate the total amount of sales for a given with the Size variable in a Treemap. You could also associate the difference between this year’s sales and last year’s sales to the Color variable for the same Treemap. This simple configuration will let you see at a glance which products are bringing in the most revenue and which products are increasing and decreasing in sales.
Each Visualization uses a different set of variables, depending on the capabilities of the visualization:
Visualizations
|
Visualization |
Variables |
|
Visual Member, Color, Size, Shape, Icons, Details, Reference Lines |
|
|
Waterfall Chart |
Timeseries Visualizations
|
Visualization |
Variables |
|
Visual Members, Color, Size, Shape, Alpha, Details, Reference Lines |
|
You can associate columns of data from the Data Table in the Design layout with the variables available for the visualizations in your dashboard.
IMPORTANT: You must be in Design Mode to add variables to visualizations.
In the sample steps below, we will associate a numeric data column called Market Cap with the Size variable in a Treemap. Then associate another numeric data column called 1 Day Change & (USD) with the Color variable.
Selecting Variables
-
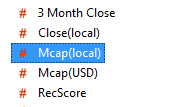
In the Data Table panel, select the column you want to associate with a variable.
In this example, we are selecting the Mcap(local) data column.
-
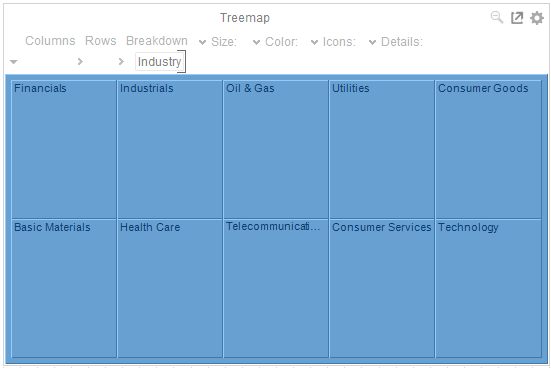
Drag the column to the variable you want to use.
In this example, we are dragging the Mcap(local) data column to the Size variable in a Treemap we have already placed in the dashboard canvas, with the Industry column added as the breakdown.
-
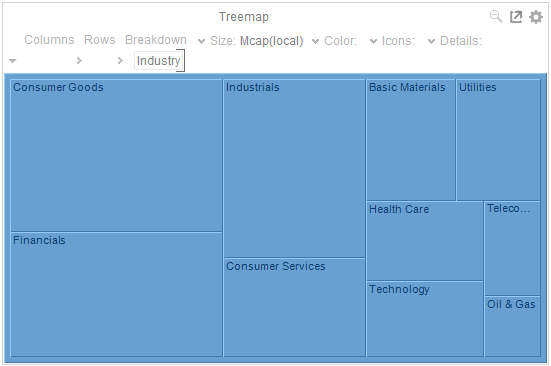
Drop the column and it will appear listed in the menu for the variable.
The Treemap also changes to reflect the values of the Mcap(local) column as the Size variable.
-
You can drag more data columns onto the same variable. This produces a list of options that the user can select from.
In our example, we have added the RecScore data column to the same Size variable for the Treemap.
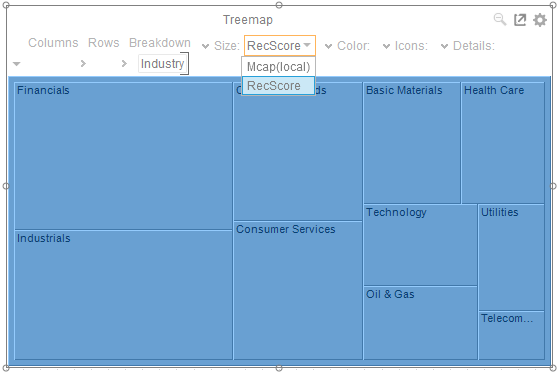
The user will be able to quickly select between two different views of the data. In one view, the Treemap will associate Mcap(local) with Size and with RecScore in the second view.
IMPORTANT: Only numeric columns containing all positive numbers should be used with the Size variable.
If you try to drag a text column or a numeric column containing any negative numbers to a Size variable, the following message displays.
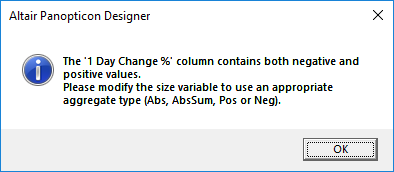
When using ABS, you have the choice of results:
-
Sum of Absolute values. (Use the Abs Aggregation Type on the Size variable).
-
Absolute Sum of values. (Use the AbsSum Aggregation Type on the Size variable)
-
Sum of Positive Values (Use the Pos Aggregation Type on the Size variable)
-
Sum of Negative Values (Use the Neg Aggregation Type on the Size variable)
-
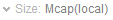
Continue associating columns to another variable in the Treemap. In this example, we are dragging the 1 Day Change % (USD) data column to the Color variable.
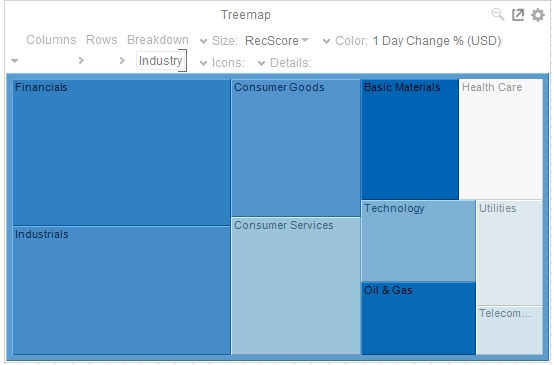
The default Color variable configuration of the added column is applied to the Treemap (i.e., White-Blue color palette, Weighted Mean aggregate, etc.). These properties can be modified to get the necessary information you need to analyze your data. For example, display Industries in the minimum range of the 1 Day Change % (USD) with a red color. Refer to Color Variable Configuration for more information.