


|
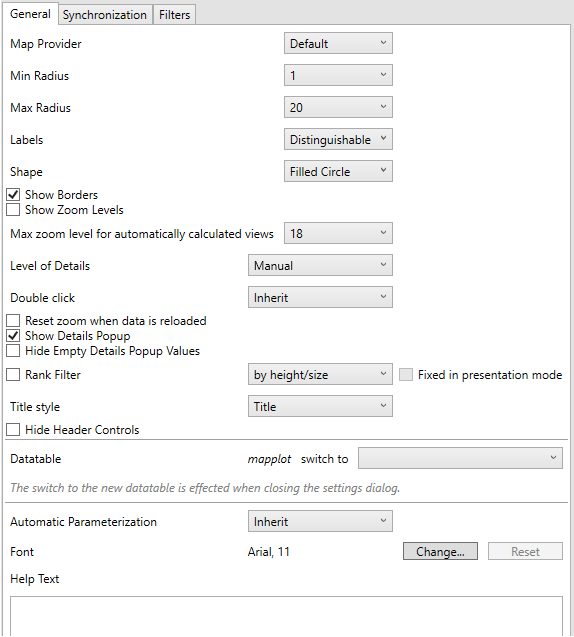
Map Plot Settings
These are divided into three tabs:
-
General
-
Setting
Description
Map Provider
Determines which Map Provider should be used for providing Map tiles.
Initially only a single map provider is defined, but more can be added by modifying the configuration.
Min Radius
The minimum radius in pixels of the data point.
Max Radius
The maximum radius in pixels of the scatter point.
Labels
How data point labels are shown. Values can be:
-
None
-
Distinguishable
-
All
Shape
The shape of the scatter point. This can be:
-
Filled Circle
-
Filled Square
Show Borders
Determines whether a border is drawn around each data point.
Show Zoom Levels
Determines whether a zoom level indicator should be displayed on the Map Plot.
Max zoom level for automatically calculated views
The maximum zoom to be applied when there is a single data point, rather than a collection, so a latitude / longitude bounding box cannot be established.
-
-
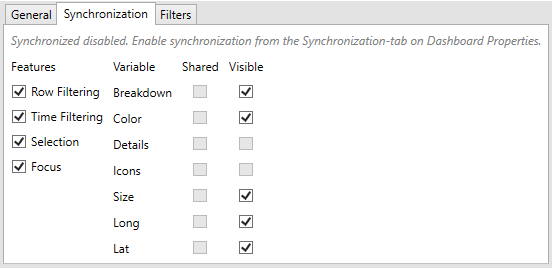
Synchronization
-
Filters
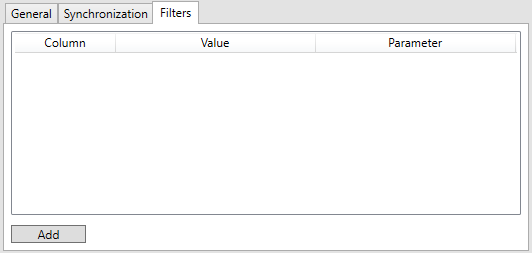
Refer to Visualization Static Filter for more information.