


|
Visualization Static Filter
You can define a filter to a visualization based on a specific subset of the available data set.
Defining Visualization Static Filter
-
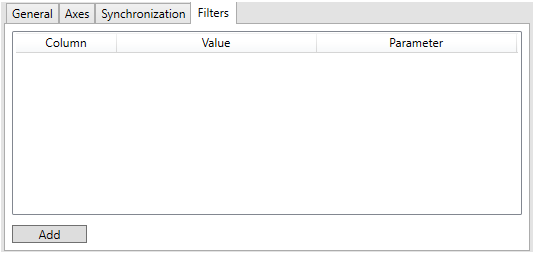
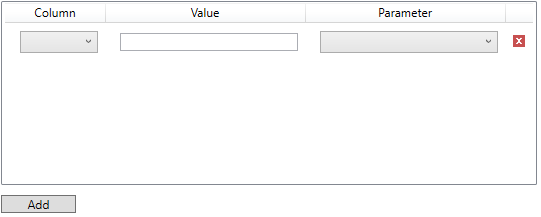
Select the Filters tab of a visualization and click Add.
-
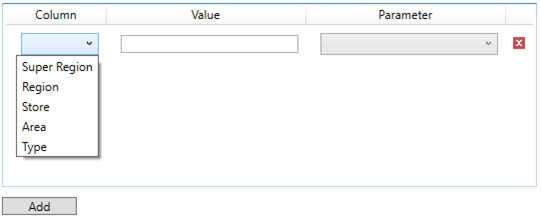
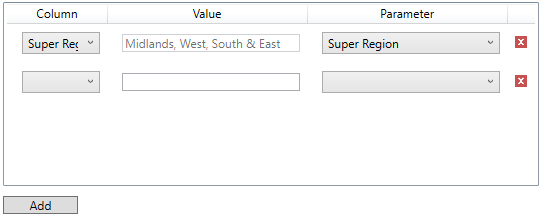
Click the Column drop-down and select a dimension.
-
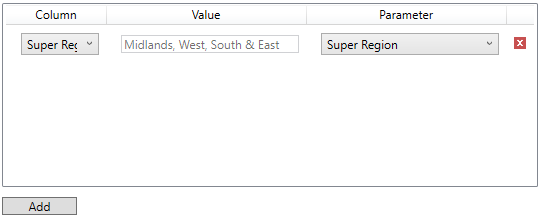
Enter a Value.
NOTE: You can add more than one value for a Column. For example:

-
You can also opt to select a set parameter value in the Parameter drop-down list.
This will overwrite the entered filter values.
-
Click Add to add more filters.
Click  to delete a visualization
filter definition.
to delete a visualization
filter definition.
-
Click Close to save the changes and apply the filter.