


|
Line Graph Settings
These are divided into four tabs:
-
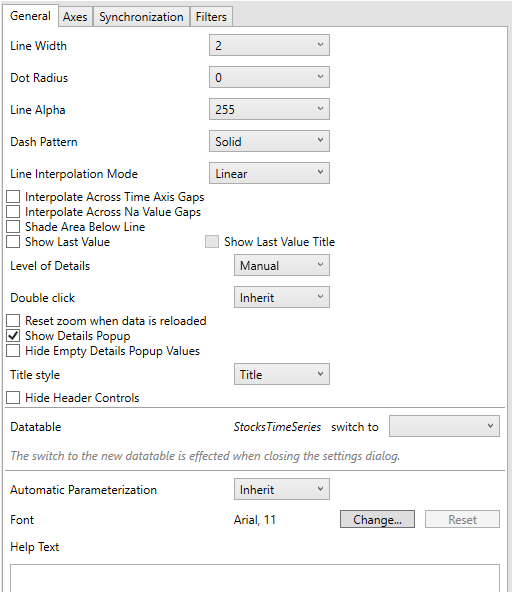
General
-
Setting
Description
Line Width
Specifies the line width in pixels.
Dot Radius
Specifies the radius of each data point in pixels.
Line Alpha
Specifies the level of color transparency/opacity. The value is from 0 to 255 with the default set to 255.
Dash Pattern
Specifies the line pattern.
Line Interpolation Mode
Specified whether the line is Stepped, or a Linear Interpolation.
Interpolate Across Time Axis Gaps
Whether time axis gaps (Working Week/Time) are interpolated.
Interpolate Across Na Value Gaps
Determines whether Na value (or missing) gaps are interpolated.
Shade Area Below Line
Defines that an alpha shade is applied between the line and the zero Y grid line, if a single line is being displayed.
Show Last Value
Determines if the flag of the last value will be displayed.
NOTES:
-
This is displayed on the right axis.
-
This is only displayed in the Web client.
Show Last Value Title
Determines if the title of the last value will be displayed in the flag.
NOTES:
-
Enabled only if Show Last Value is checked.
-
This is only displayed in the Web client.
-
-
Axes
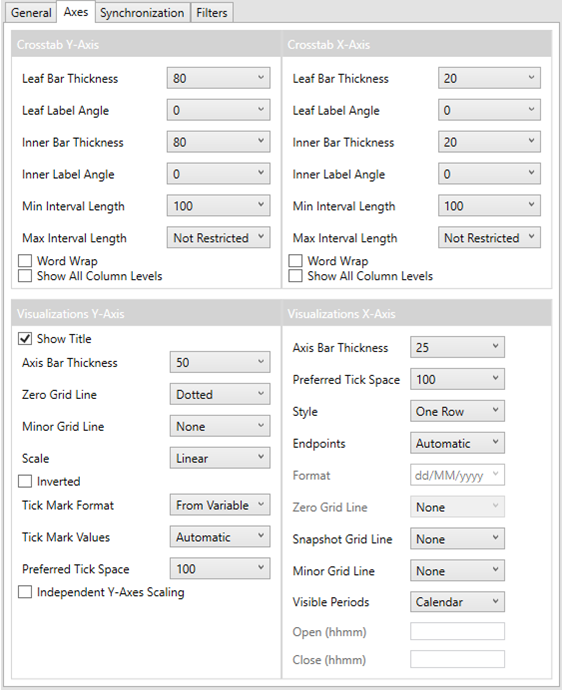
Refer to Visualizations Axes, Cross Tab Axes, and Time Axes for more information.
-
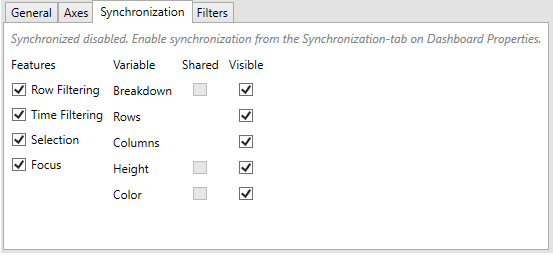
Synchronization
-
Filters
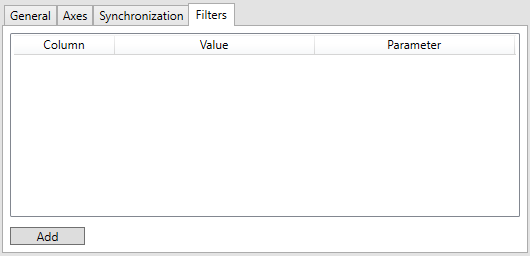
Refer to Visualization Static Filter for more information.