


|
Time Axis
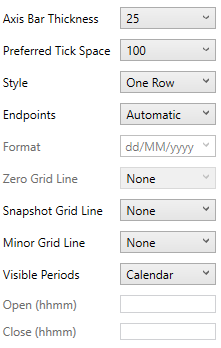
Visualizations supporting time axes include the following settings:
|
Setting |
Description |
|
Axis Bar Thickness |
The margin in pixels for the Time Axis. The Time Axis is hidden if this is set to zero. |
|
Preferred Tick Space |
The preferred space in pixels between minor grid lines across the axis. |
|
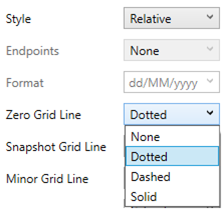
Style
|
Defines that the time based axis is displayed across two rows, with the start and end points displayed on the bottom row. When Relative is selected, the time forwards and backwards from a set time (i.e., midnight will be shown as 00:00 on the axis) will be displayed. The prior hours/days from the midnight at the start of day are negative and the future hours/days are positive. For example:
The axis values can have the following tick mark labels: -12.00, -6.00, 0:00, 6.00, 12:00 |
|
Endpoints
|
Determines whether to display endpoints. Allowed values:
|
|
Format |
Determines the Date/Time format when the endpoint is Custom. |
|
Zero Grid Line
|
For the Relative Style, set how a major X-axis grid line is drawn:
|
|
Snapshot Grid Line
|
Determines whether a grid line is drawn showing the snapshot location. Allowed values:
When the Snapshot Grid Line is rendered, the Set Snapshot Here option will be available in the visualization context menu in the Web Client. |
|
Minor Grid Line
|
Determines whether minor grid lines are drawn across the axis. Allowed values:
|
|
Visible Periods
|
Determines whether:
|
|
Open (hhmm) |
Defines what time the market opens. |
|
Close (hhmm) |
Defines what time the market closes. |
Plus:
-
Axis Type (Visible Periods)
Which can be:
-
Calendar
-
Work Week (Hide Weekends)
-
Work Hours (Hide Closed Periods)
If Visible Periods is set to Work Hours, the Open and Close edit boxes are enabled.
If enabled, by default they will only display times on a time series visualization from 09:30 a.m. until 4:00 p.m. Monday to Friday.