


|
BoxPlot Variable Configuration
The BoxPlot variable is available in the Box Plot visualization.
BoxPlot Variable Configuration
-
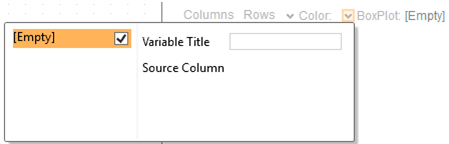
Click the down arrow
 icon to the left of the BoxPlot variable. Initially, the variable
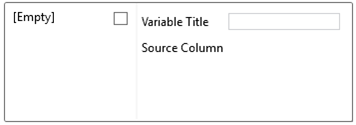
has an [Empty] value.
icon to the left of the BoxPlot variable. Initially, the variable
has an [Empty] value.
-
Check the [Empty] box to enable this value.
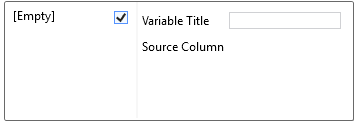
Clicking on the [Empty] value highlights this section and currently displays as the associated value of the BoxPlot variable.
This means that there is no (empty) value associated to the BoxPlot variable.
-
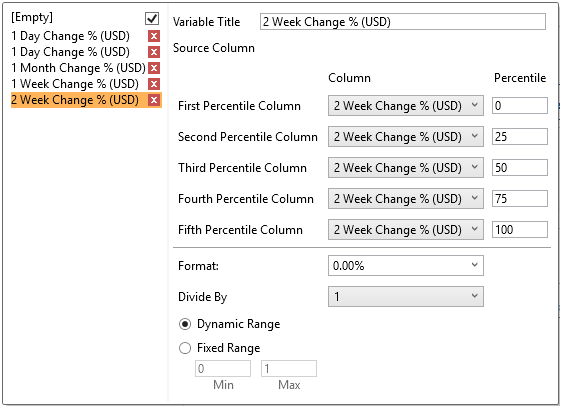
To associate other columns from the data table, drag and drop them to the BoxPlot variable area. Select one to display the corresponding configuration panel.
-
Enter a label for the variable in the Variable Title field.
You can parameterize the variable title to support dynamic schema in the dashboards.
-
Unlike other variables, BoxPlot requires five different numeric variables with aggregates in the following order: First Percentile, Second Percentile, Third Percentile, Fourth Percentile, and Fifth Percentile.
The percentile values of the member variables are configurable. Each percentile can be set to any value between 0 to 100. The values default to 0 (Min), 25 (First Quartile), 50 (Median), 75 (Third Quartile), 100 (Max), respectively.
NOTE: In case the boxplot is compared to the boxplot in MS Excel, ensure it is configured to use the inclusive median.
Dragging a column to the BoxPlot variable’s shelf, all of the five sub variables are automatically populated with this column. This allows for automatically drawing a boxplot based on a single column. The variable also allows for changing each column of each sub variables, which can be used in case the values are precalculated.
-
The Format field lets you specify the format that numbers will be displayed in. Panopticon Designer (Desktop) uses the same formatting rules as Excel.
-
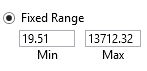
The visible range for the variable can either be calculated dynamically (the default, Dynamic Range) or set between predefined limits by selecting Fixed Range radio button. This reveals the Min and Max text boxes and populates them with default values taken from the data set.
-
Select the Divide By value to divide a number:
-
-
1
-
1000 (by a thousand)
-
10000
-
1000000 (by a million)
-
1000000000 (by a billion)
-