


|
Scatter Plot Settings
These are divided into four tabs:
-
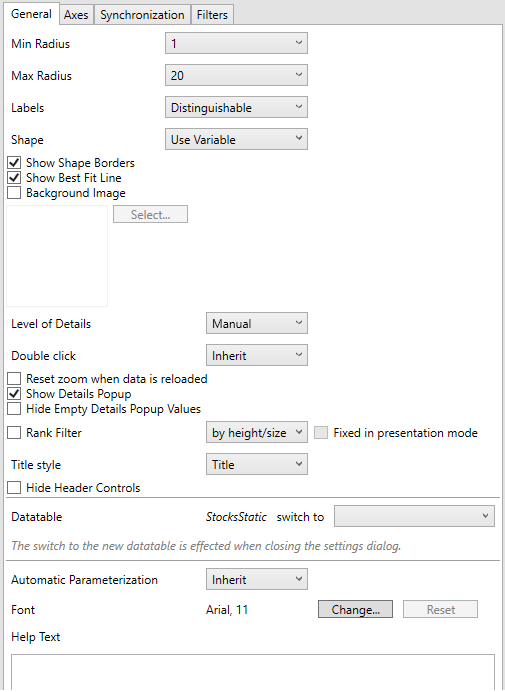
General
|
Setting |
Description |
|
Min Radius |
The minimum radius in pixels of the scatter point. |
|
Max Radius |
The maximum radius in pixels of the scatter point. |
|
Labels
|
How scatter point labels are shown. Values can be:
|
|
Shape
|
The shape of the scatter point. This can be:
|
|
Show Borders |
Determines whether a border is drawn around each scatter point. |
|
Show Best Fit Line |
Determines whether a Line of Best Fit is added to the Scatter Plot. |
|
Background Image
|
Defines that a background image is displayed behind the scatter plot, and allows the image file to be selected. |
-
Axes
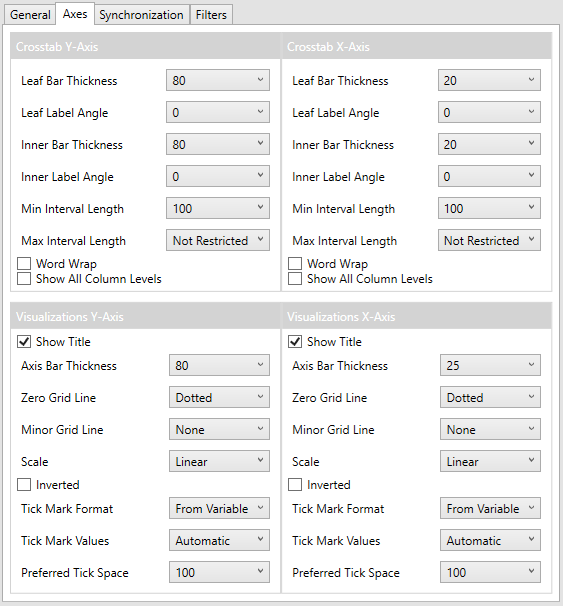
Refer to Cross Tab Axes or Visualization Axes for more information.
-
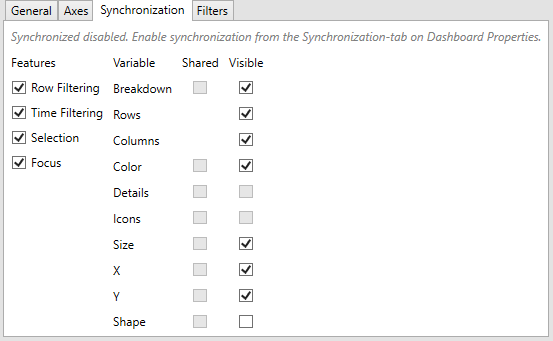
Synchronization
-
Filters
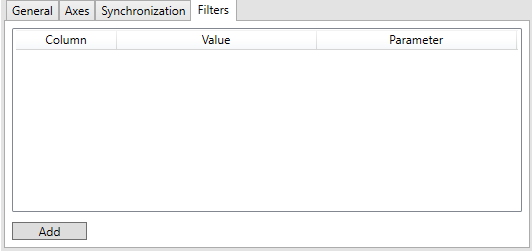
Refer to Visualization Static Filter for more information.