


|
Pie Chart Settings
These are divided into four tabs:
-
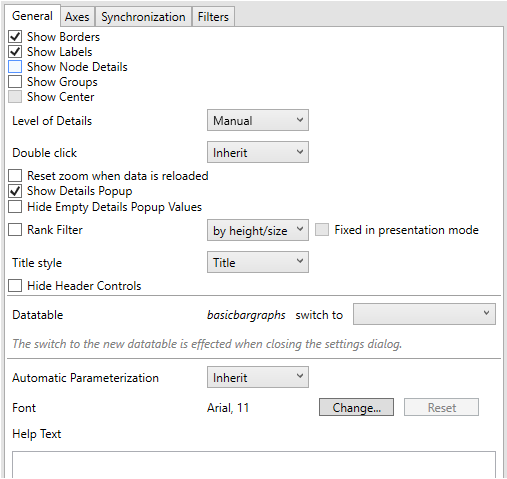
General
-
Setting
Description
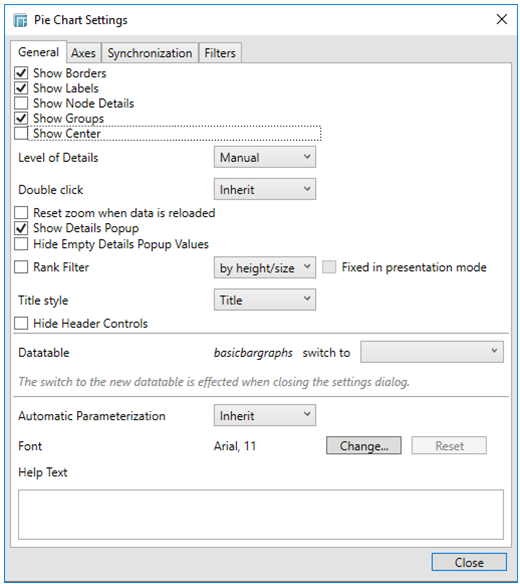
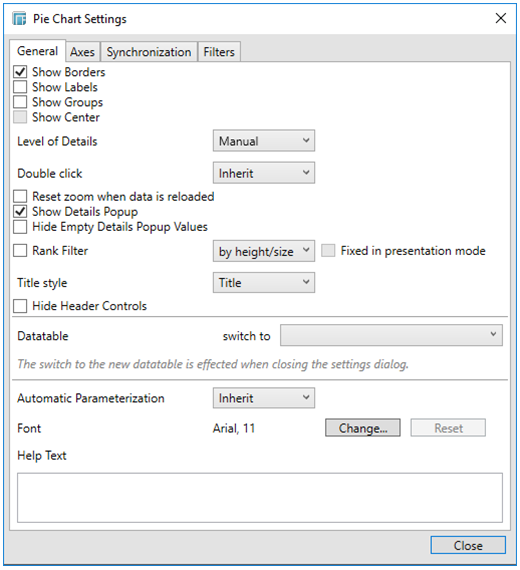
Show Borders
Determines whether borders are drawn around each pie slice. This is enabled by default.
Show Labels
Determines whether labels are displayed within each pie slice.
Show Groups
Determines whether a multilevel Pie Chart (or Sun Burst) is displayed, where each hierarchy level is represented in a nested group.
Show Center
If Groups are enabled, specify whether the center is used to show the aggregate position for the total data set.
Show Node Details
Determines whether to display node details.
-
Axes
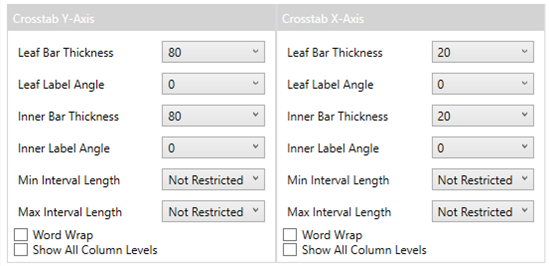
Refer to Cross Tab Axes for more information.
-
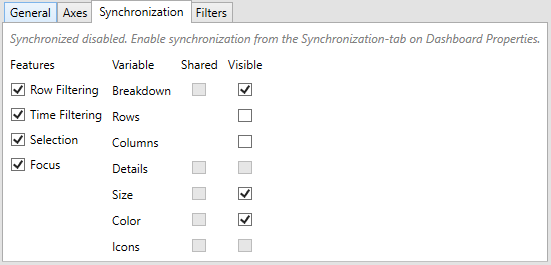
Synchronization
-
Filters
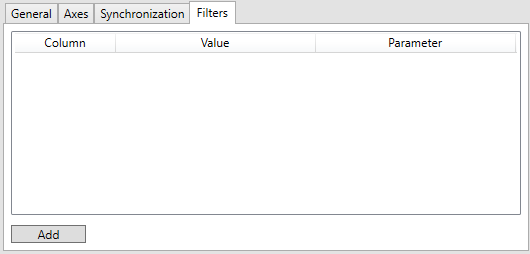
Refer to Visualization Static Filter for more information.
NOTE:
Starting version 13.1, the ability to show node details in the pie chart visualization was added. For pie charts created before the feature was available, the Show Node Details option is displayed in the Pie Chart Settings dialog to enable the node details feature.
Checking the Show Node Details box upgrades the Pie Chart to the new version settings, at which point further editing can be done through the details view.
Upon clicking the Settings link of the pie chart with enabled node details, the Show Node Details option is not displayed anymore.
TROUBLESHOOTING: Pie Charts Not Displaying Correctly in Chrome (Web Client)
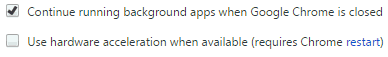
When Hardware Acceleration is enabled in Chrome, Pie Chart visualization may not display as expected.
To resolve this issue, follow the steps below to disable Hardware Acceleration in Chrome:
-
Open the Chrome web browser.
-
You can either:
-
-
click
 to the right
of the Address box and
select Settings
to the right
of the Address box and
select Settings
-
-
-
or enter chrome://settings in the Address box
-
-
Scroll to the bottom of the page and click Show Advanced Settings…
-
Uncheck Use Hardware Acceleration when Available box.
-
Restart Chrome.