


|
Surface Plot Settings
These are divided into four tabs:
-
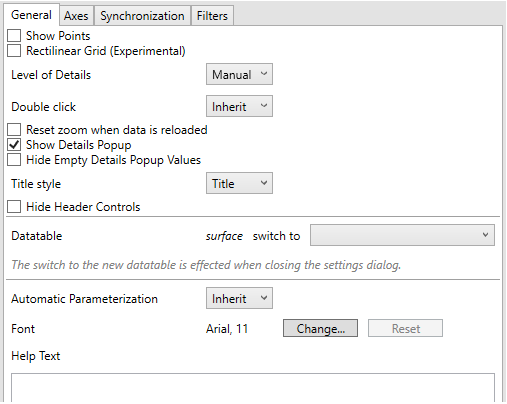
General
|
Setting |
Description |
|
Show Points |
Determines whether surface data points are shown. |
|
Rectilinear Grid |
Determines whether distinct x and y values are changed into a rectilinear grid where missing values are filled in with a default of zero (or the ground level). |
-
Axes
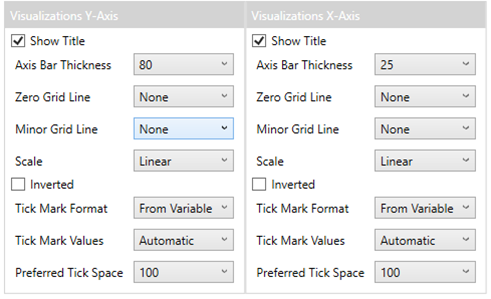
Refer to Visualizations Axes for more information.
-
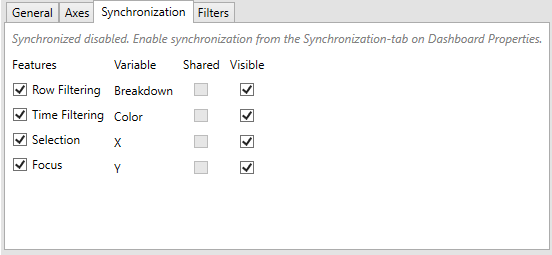
Synchronization
-
Filters
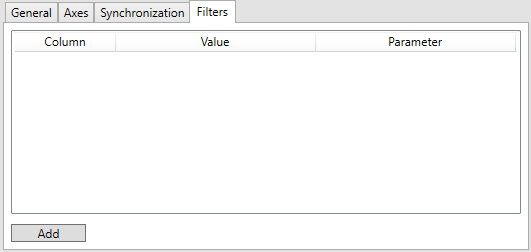
Refer to Visualization Static Filter for more information.