


|
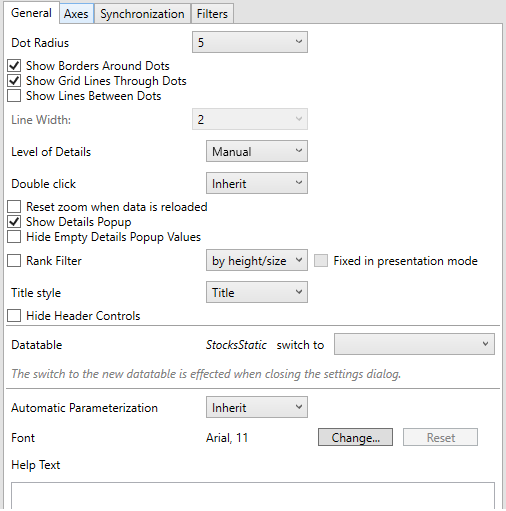
Dot Plot Settings
These are divided into four tabs:
-
General
-
Setting
Description
Dot Radius
Specifies the radius of each dot in pixels.
Show Borders Around Dots
Determines whether a border is drawn around each dot.
Show Grid Lines Through Dots
Determines whether grid lines are drawn through each dot.
Show Lines Between Dots
Determines whether a line is drawn between the dots category constituents. Allows a categorical line graph to be displayed.
Line Width
Specifies the width in pixels of the line if enabled.
-
Axes
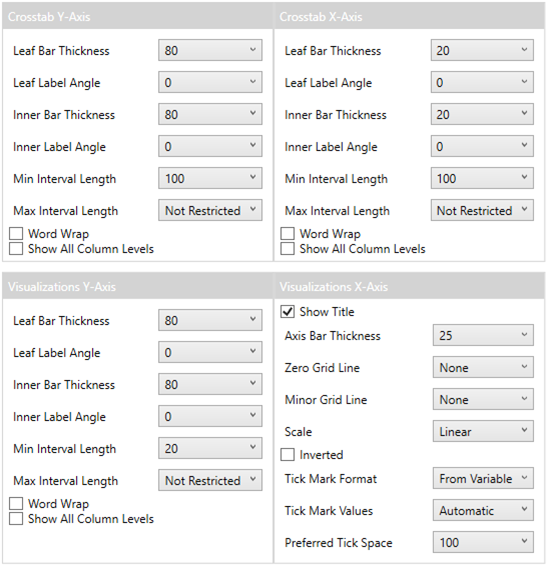
Refer to Visualizations Axes and Cross Tab Axes for more information.
-
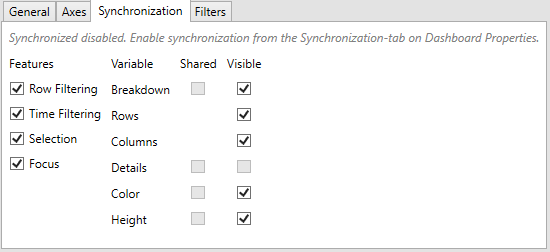
Synchronization
-
Filters
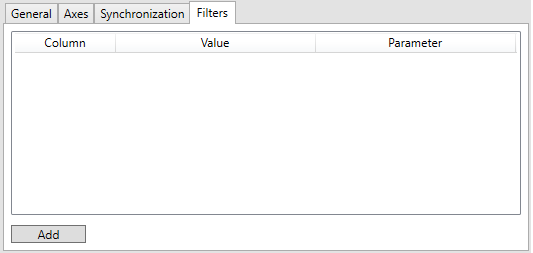
Refer to Visualization Static Filter for more information.