|
Cross Tabbing & Breakdowns
You can define hierarchical structures called breakdowns for each visualization. The hierarchy may be flat (a single level) or multi-level. You can also define multiple breakdowns for each visualization so the user can select the one most appropriate for the analysis task at hand.
The breakdown consists of up to three components:
-
Rows (Cross Tab the visualization into rows)
-
Columns (Cross tab the visualization into columns)
-
Hierarchy (Display the hierarchy within the visualization.
Not all visualizations support all three.
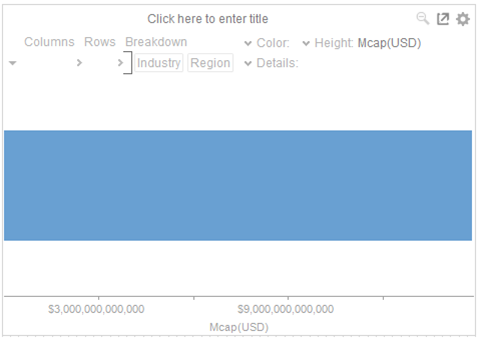
If no breakdown is defined, a single aggregated data point will be shown in the visualization.
A cross tab is the division of a single visualization into smaller multiple visualizations across either rows, columns or both. Each smaller child visualization displays the relevant portion of the data set. It can also be called trellising, or small multiples.
The purpose of a cross tab is to allow comparison across portions of the data set.
The Breakdown area appears on the top left of each visualization.
Cross Tabbing & Breakdowns
To add to the breakdown, drag and drop text columns from the Data Table panel to the Breakdown area.
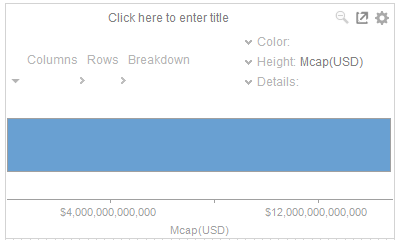
A Bar Graph without a breakdown will show a single bar. For the example below, the Mcap(USD) column was dragged and dropped to the Height variable.
Dragging a column to Breakdown, will break apart the aggregated data into separate bars.
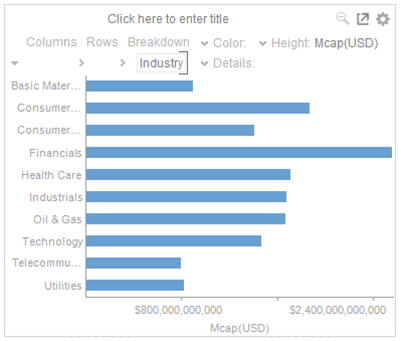
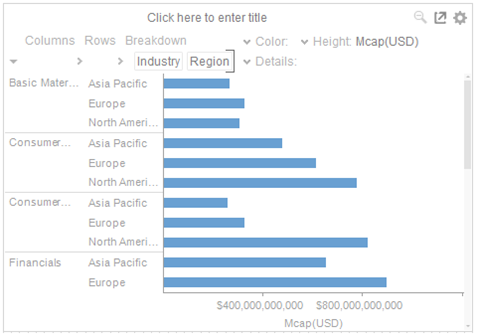
Dragging a further column into the breakdown will produce a multi-level hierarchy.
If the column has been dropped into the incorrect position, simply click and drag the column to the correct position.
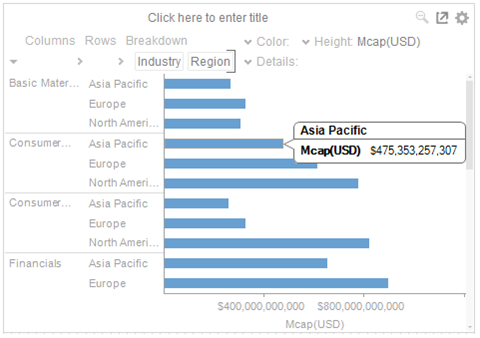
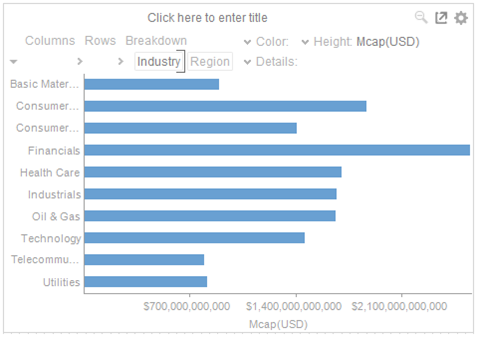
The visible detail level of the multi-level hierarchy can be adjusted by clicking on the breakdown column itself.
This will grey out the hierarchy level. Clicking again will update the display to show the level of detail again.
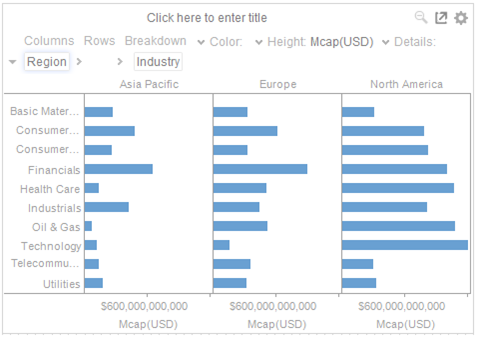
To cross tab the visualization drag columns into the Rows or Columns drop areas, either from the Data Table Panel, or from the existing dropped text columns.
One dropped, the visualization will be cross tabbed, producing a series of smaller visualizations for each item within the column dropped.
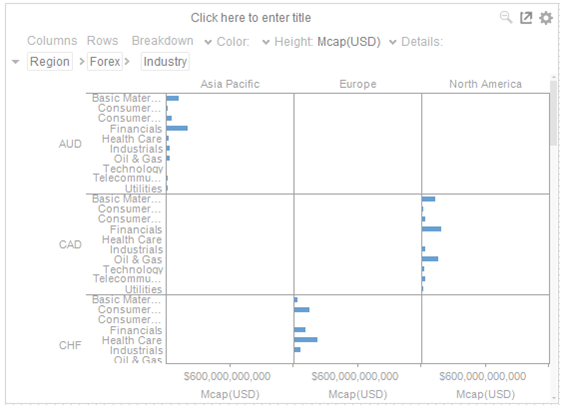
Cross tabs can be across rows, across columns, or across both where two separate cross tabbing dimensions have been selected.
Dropping a text column onto the Columns area produces:
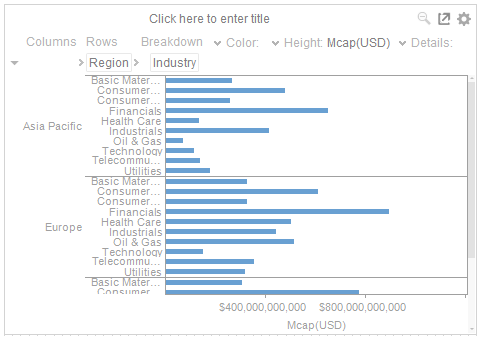
While dropping a column onto the Rows area produces:
And finally dropping columns onto both Rows and Columns produces a series of smaller trellised visuals. Each showing the specified subset of the overall data set.