


|
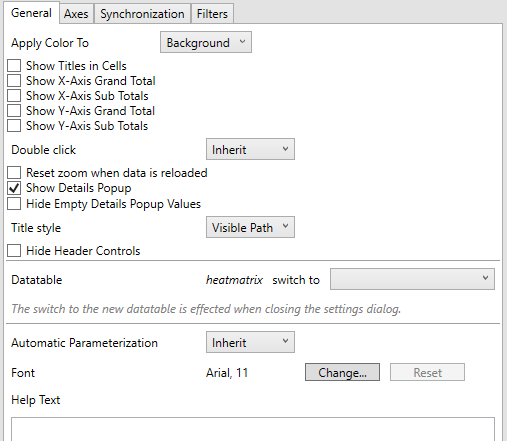
Heat Matrix Settings
These are divided into four tabs:
-
General
|
Setting |
Description |
|
Apply to Color To |
Sets how the color variable is displayed: Background or Text. |
|
Show Titles in Cells |
Determines whether the field Title is shown in the cell. |
This visualization also acts as a Pivot Table, like the current cross tabbed tile, with rows and columns. In addition, it is similar with the Table visualization as it displays row totals.
You can set these properties in the following controls:
|
Setting |
Description |
|
Show X-axis Grand Total
|
Determines whether to display the grand total of the values of the Color and Detail variables on the X-axis (either as data in the cells or in the Pop-up). |
|
Show X-Axis Sub Totals
|
Determines whether to display the sub totals of the values of the Color and Detail variables on the X-axis (either as data in the cells or in the Pop-up). |
|
Show Y-Axis Grand Total
|
Determines whether to display the grand total of the values of the Color and Detail variables on the Y-axis (either as data in the cells or in the Pop-up). |
|
Show Y-Axis Sub Totals
|
Determines whether to display the sub totals of the values of the Color and Detail variables on the Y-axis (either as data in the cells or in the Pop-up). |
NOTE: The enabled Totals (Grand Total or Subtotals), for the X and Y axes, are only displayed in the Web Client.
-
Axes
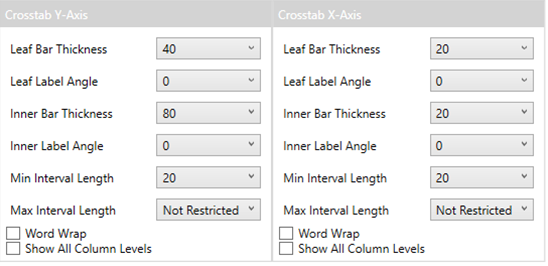
Refer to Cross Tab Axes for more information.
-
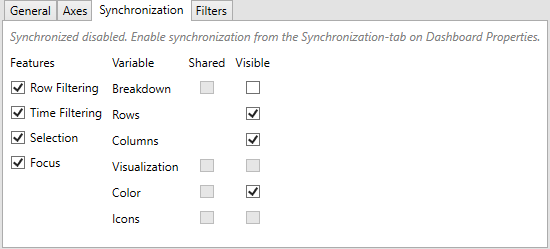
Synchronization
-
Filters
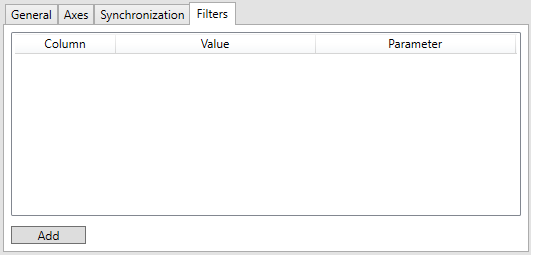
Refer to Visualization Static Filter for more information.