


|
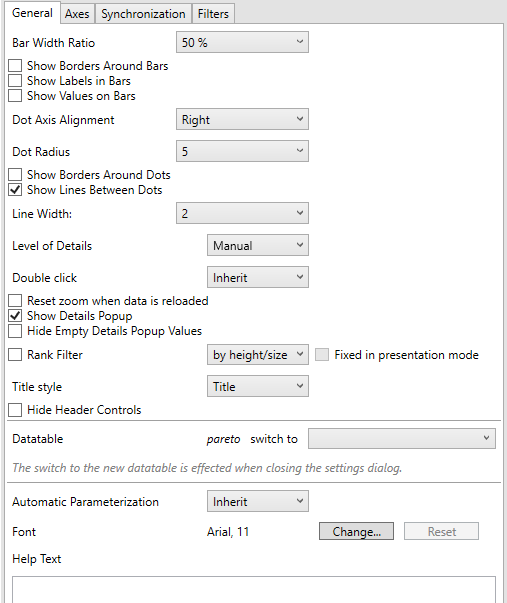
Pareto Chart Settings
These are divided into four tabs:
-
General
-
Setting
Description
Bar Width Ratio
Defines the ratio between Bars and space between the bars.
Show Borders Around Bars
Specifies whether borders are drawn around bars or stacks within bars.
Show Labels in Bars
Specifies whether labels are drawn inside the bars.
Show Values in Bars
Specifies whether values are displayed in bars.
Dot Axis Alignment
Determines whether the dot axis is aligned to the Right or Left.
Dot Radius
Specifies the radius of each data point in pixels.
Show Borders Around Dots
Specifies whether a border is drawn around each dot.
Show Lines Between Dots
Specifies whether a line is drawn between the dots category constituents. Allows a categorical line graph to be displayed.
Line Width
Specifies the width in pixels of the line if enabled.
-
Axes
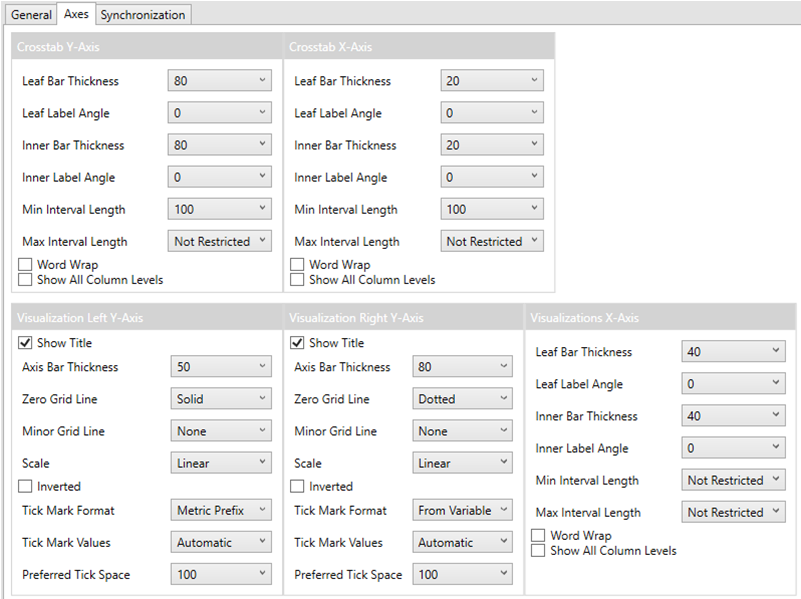
Refer to Cross Tab Axes and Visualizations Axes for more information.
-
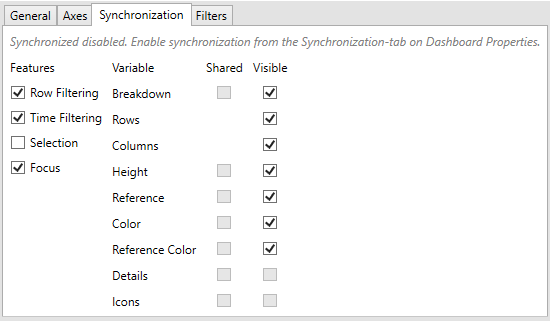
Synchronization
-
Filters
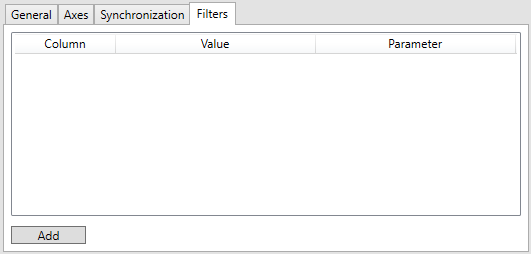
Refer to Visualization Static Filter for more information.