


|
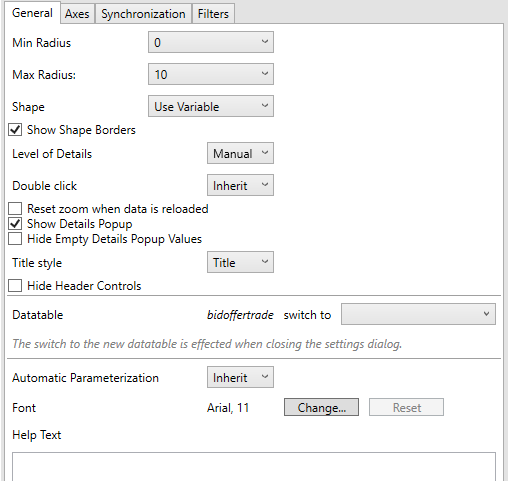
Time Series Scatter Plot Settings
These are divided into four tabs:
-
General
-
Setting
Description
Min Radius
The minimum radius in pixels of the scatter point.
Max Radius
The maximum radius in pixels of the scatter point.
Show Circle Borders
Determines whether a border is drawn around each scatter point.
Shape
The shape of the scatter point. This can be:
-
Filled Circle
-
Circle
-
Filled Square
-
Square
-
Use Variable - shapes can be specified for the elements in the visualization through the Shape variable
-
-
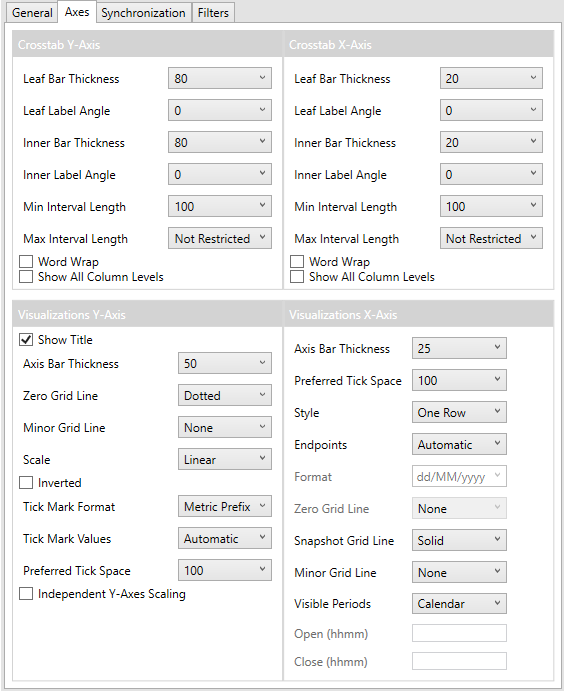
Axes
-
Refer to Cross Tab Axes, Visualizations Axes, and Time Axes for more information.
-
-
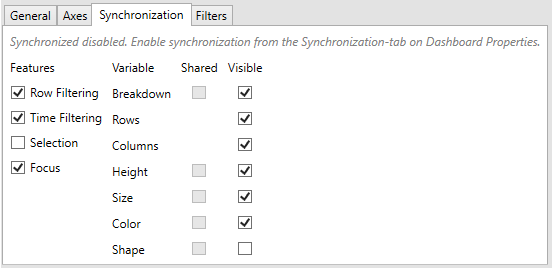
Synchronization
-
Filters
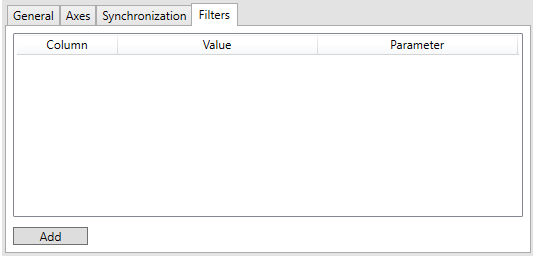
Refer to Visualization Static Filter for more information.