


|
Color Variable Configuration
You can associate either numeric or text columns with the Color variable.
The configuration panel for the Color variable changes depending on the type of data in the data column.
When a text column is added to the Color variable, the configuration panel displays the color associated with each categorical item, as specified with a default color palette.
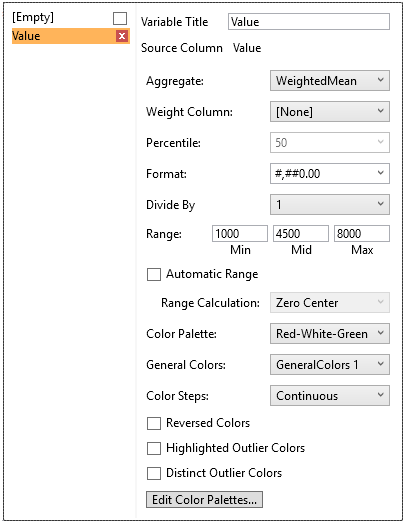
For numeric columns associated to the Color variable, the configuration panel changes where you can specify the color properties.
All the static and time series visualizations have the Color variable except in the Spread Graph.
The configuration panel of the Reference Color variable in the Pareto Chart visualization is the same as what is discussed in this section.
In this section, we will discuss the Color variable configuration for text columns.
Color Variable Configuration for Text Columns
-
Click the down arrow
 icon to the left of the Color variable. Initially, the variable
has an [Empty] value.
icon to the left of the Color variable. Initially, the variable
has an [Empty] value.
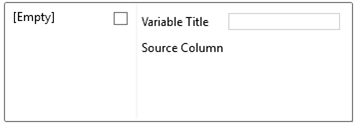
-
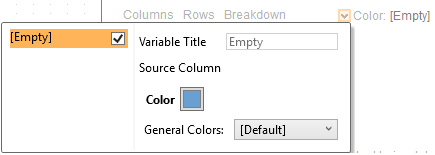
Check the [Empty] box to enable this value.
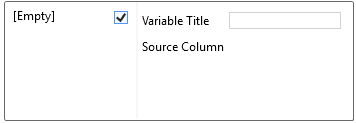
Clicking on the [Empty] value highlights this section and currently displays as the associated value of the Color variable. By default, the values are set for the Color and General Colors to be used.
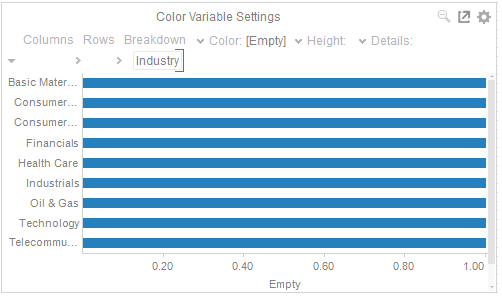
For
example, in this Bar Graph – Horizontal visualization, the Industry
column is added as the breakdown, when the [Empty]
value is selected, the color will be set to  and the General
Colors that will be used in the visualization (e.g., axis,
background, border, focus, etc.) will be [Default]:
and the General
Colors that will be used in the visualization (e.g., axis,
background, border, focus, etc.) will be [Default]:
You can opt to modify the following properties:
|
Property |
Description |
|
Color |
The color of the associated variable to Color. |
|
General Colors |
General colors to be used in the visualization that were defined in the Workbook Theme. |
-
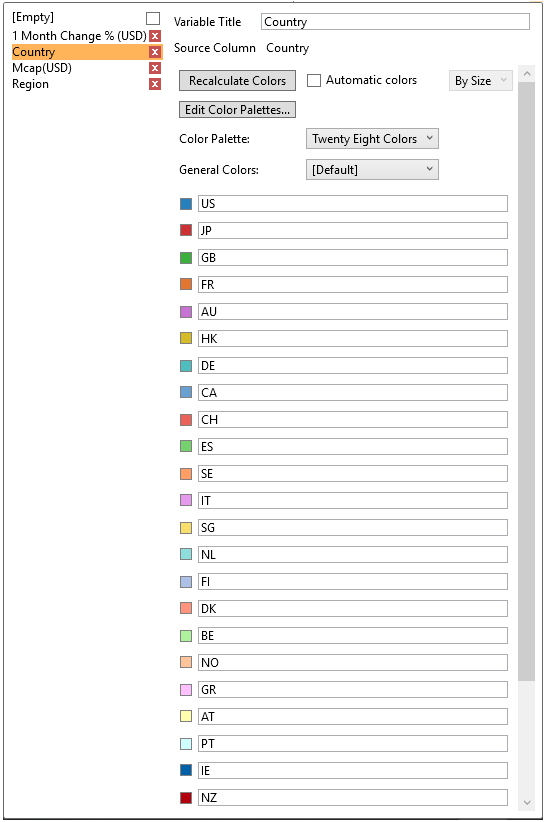
To associate other columns from the data table, drag and drop them to the Color variable area. Select one to display the corresponding configuration panel.
-
Enter the label for the Color variable in the Variable Title field.
You can parameterize the variable title to support dynamic schema in the dashboards.
-
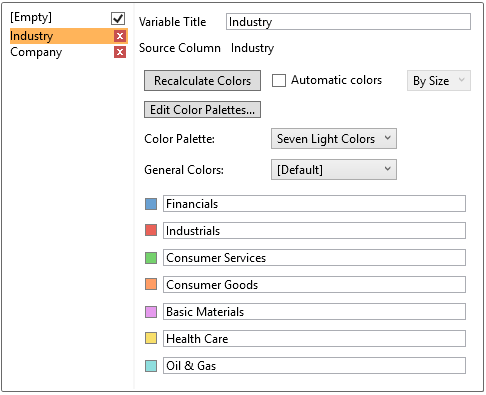
Click on the Color Palette list box to change the color palette.
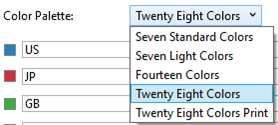
The color palettes available on this drop-down are defined in the Color Palettes tab of the Altair Panopticon Options dialog and enabled in the Color Palettes tab of the Workbook Theme dialog.
-
Edit the color palette by clicking on the Edit Color Palettes button. The Color Palettes dialog displays.
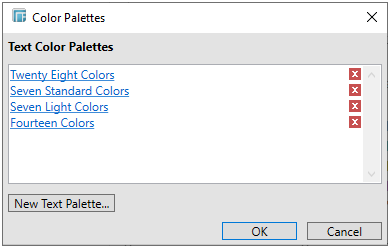
-
Click a color palette that you want to modify.
The Text Color Palette dialog box is displayed.
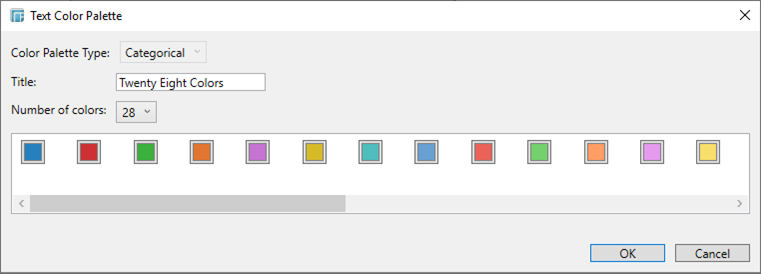
-
You can change colors used in the palette and give the palette a unique label in the Title field.
-
Select the General Colors to use.
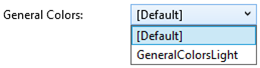
The general color settings available on this drop-down are defined in the General Colors tab of the Workbook Theme dialog.
-
Click the Recalculate Colors button to re-retrieve the categorical items and match them to the color palette.
-
Checking the Automatic colors check box enables the Modes drop-down box:
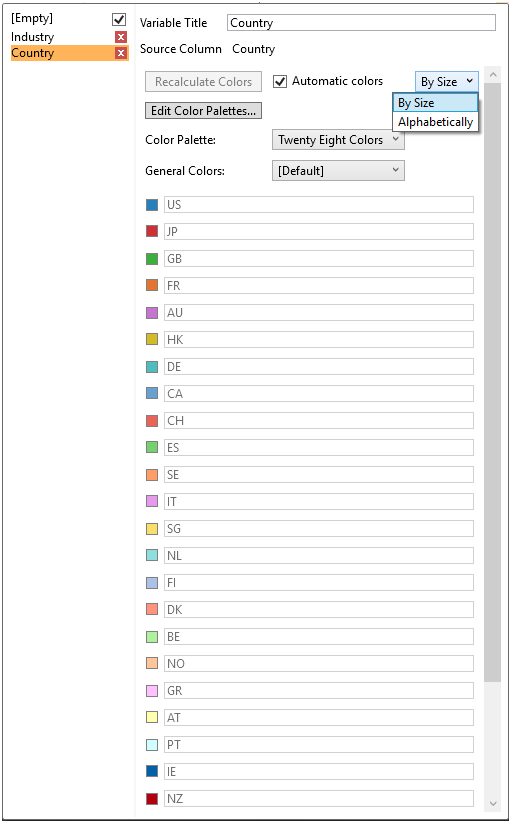
-
You can either assign the categorical color assignment when new data is dynamically loaded into the visualization:
-
-
By Size
-
The color assignment is based on the Size variable.
-
-
Alphabetically
-
The color assignment is done alphabetically.
NOTE:
This would occur for example as a result of navigation action defining a parameterized data set to be displayed in the visualization.