|
Icons Variable Configuration
You can drop numeric and text columns onto the Icon variable. The options available in the configuration panel will depend on the type of data in the column. You can also create multiple for each single source column.
The Heat Matrix, Treemap, and Table visualizations have the Icons variable.
Configuring Icon Variables
-
To associate columns from the data table, drag and drop them to the Icons variable area.
-
Click the down arrow
 icon to the left of the Icons variable.
This displays the configuration panel.
-
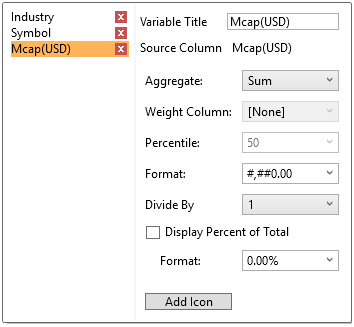
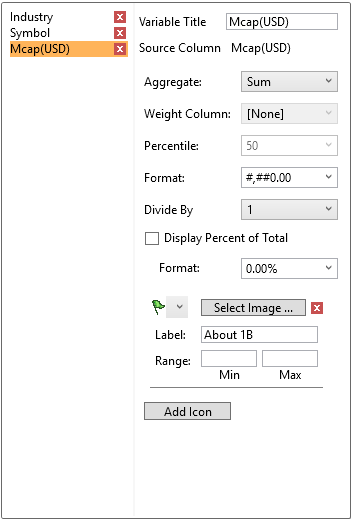
Enter a label for the Icon variable in the Variable Title field.
-
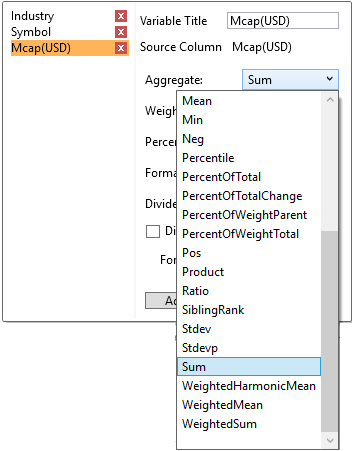
You can also specify an the aggregation method for numeric columns in the Aggregate field. The default value is Sum.
-
-
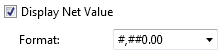
If the aggregation method is set to PercentOfTotal, the Display Net Value section enabled.
-
-
If this is checked the Net Value will be displayed in brackets after the Percentage of Total in the detail popup.
-
-
Then set the Format.
-
-
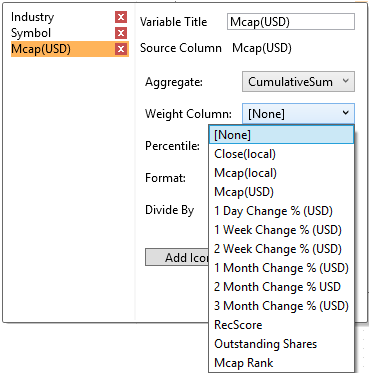
If you set the aggregation method to Cumulative Sum, Cumulative Sum By Max, Ratio, Percent of Weight Parent, Percent Weight of Total, Weighted Harmonic Mean, Weighted Mean, or Weighted Sum, the Weight Column drop-down list is enabled that allows you to select the weight column to be used.
-
-
-
-
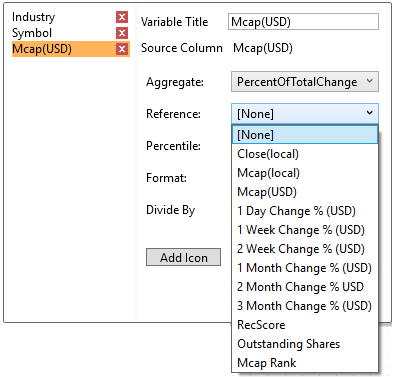
If you set the aggregation method to Percent of Total Change, the Reference is enabled that allows you to select a reference column to use.
-
-
-
-
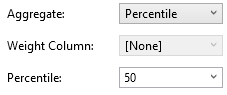
If you set the aggregation method to Percentile, the Percentile drop-down list is enabled and displays a list of values that can be used to calculate the value of the selected percentile. Default is 50.
-
-
-
-
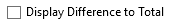
If you set the aggregation method to Harmonic Mean, Max, Mean, Min, Product, Weighted Harmonic Mean, or Weighted Mean, the Display Difference to Total section is enabled
-
-
-
If this is checked, the difference to total will be displayed in brackets after the aggregation value in the detail pop-up.
-
The Format field lets you specify the format that numbers will be displayed in. Panopticon Designer (Desktop) uses the same formatting rules as Excel.
-
Select the Divide By value to divide a number:
-
-
1
-
1000 (by a thousand)
-
10000
-
1000000 (by a million)
-
1000000000 (by a billion)
-
-
Click Add Icon to complete the task.
Clicking the Add Icon button with a numeric column displays an additional panel.
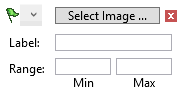
Here you can specify:
-
-
Icon Image (from the Icons tab of the Altair Panopticon Options dialog)
-
You can pick from the list or browse to a file.
-
-
Icon label
-
Deletion of an icon

-
-
-
Numeric range to display icons.
-
Leaving the Min or Max fields empty implies no limit.
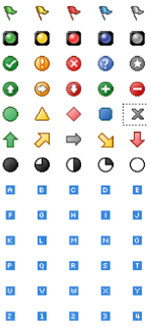
Panopticon Designer (Desktop) includes these icon images:
The icon will display to the right of the column title and will display instantly in the Visualization for nodes that meet the specified range criteria.
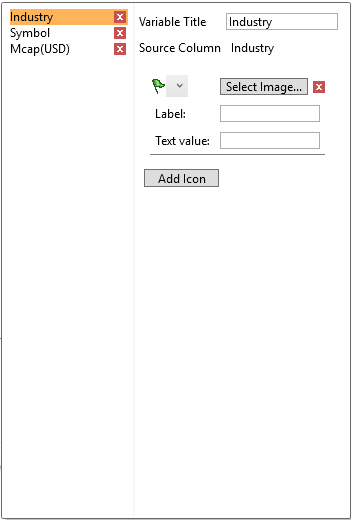
You can add Icons based on Text columns in a similar way.
-
Drag columns from the data table onto the Icons variable.
-
Define a Title, select an Icon image and enter a Label.
The Text Value field lets you specify a text string. When a node in the Visualization matches the text string, Panopticon Designer (Desktop) will display the Icon. Leaving the Text Value field empty creates a match on non-empty strings.