


|
Alpha Variable Configuration
The Alpha variable is available in the Scatter Plot, Timeseries Scatter Plot, and Timeseries Scatter Plot in the Combination Graph visualizations.
Alpha Variable Configuration
-
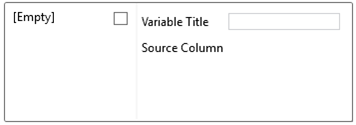
Click the down arrow
 icon to the left of the Alpha variable. Initially, the variable
has an [Empty] value.
icon to the left of the Alpha variable. Initially, the variable
has an [Empty] value.
-
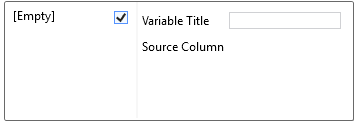
Check the [Empty] box to enable this value.
Clicking on the [Empty] value highlights this selection and currently displays as the associated value of the Alpha variable with the Alpha Value set to 100% by default.
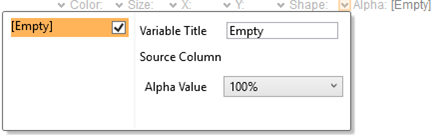
You can opt to modify the following properties:
|
Property |
Description |
|
Variable Title |
The name of the associated variable to Alpha. |
|
Alpha Value |
Alpha value of the Alpha variable. The two nearest valid values are 0% and 100%. |
-
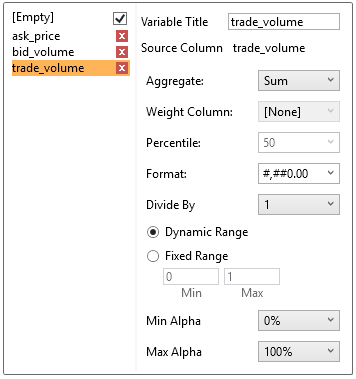
To associate other columns from the data table, drag and drop them to the Alpha variable area. Select one to display the corresponding configuration panel.
This displays the configuration panel.
-
Enter a label for the Alpha variable in the Variable Title field.
You can parameterize the variable title to support dynamic schema in the dashboards.
-
The Format field lets you specify the format that numbers will be displayed in. Panopticon Designer (Desktop) uses the same formatting rules as Excel.
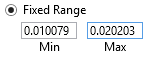
The visible range for the Alpha variable can either be calculated dynamically (the default) or set between predefined limits by selecting Fixed Range radio button. This reveals the Min and Max text boxes and populates them with default values taken from the data set.
-
You can also specify an aggregation method in the Aggregate field.
The default value is Sum.
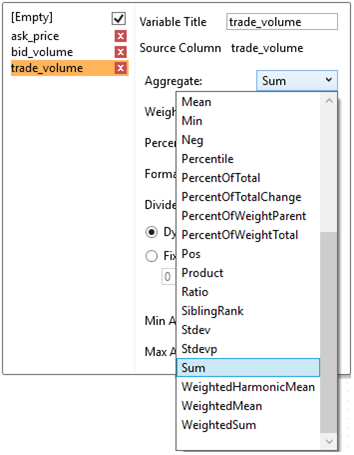
The Alpha Variable also supports a large number of other aggregation types.
-
-
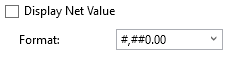
If the aggregation method is set to PercentOfTotal, the Display Net Value section enabled.
-
-
If this is checked the Net Value will be displayed in brackets after the Percentage of Total in the detail popup.
-
-
Then set the Format.
-
-
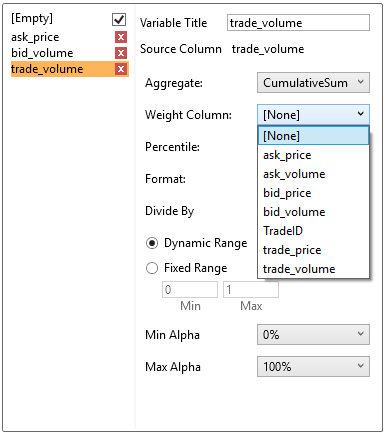
If you set the aggregation method to Cumulative Sum, Cumulative Sum By Max, Ratio, Percent of Weight Parent, Percent Weight of Total, Weighted Harmonic Mean, Weighted Mean, or Weighted Sum, the Weight Column drop-down list is enabled that allows you to select the weight column to be used.
-
-
-
-
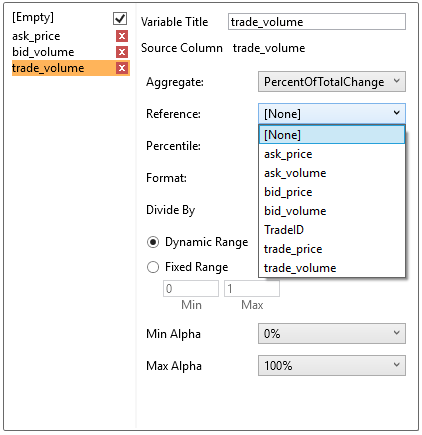
If you set the aggregation method to Percent of Total Change, the Reference is enabled that allows you to select a reference column to use.
-
-
-
-
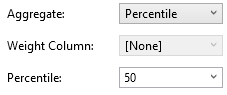
If you set the aggregation method to Percentile, the Percentile drop-down list is enabled and displays a list of values that can be used to calculate the value of the selected percentile. Default is 50.
-
-
-
-
If you set the aggregation method to Harmonic Mean, Max, Mean, Min, Product, Weighted Harmonic Mean, or Weighted Mean, the Display Difference to Total section is enabled
-
-

-
If this is checked, the difference to total will be displayed in brackets after the aggregation value in the detail pop-up.
-
Select the Divide By value to divide a number:
-
-
1
-
1000 (by a thousand)
-
10000
-
1000000 (by a million)
-
1000000000 (by a billion)
-
-
The visible range can either be calculated dynamically (Dynamic Range) or set between predetermined limits by selecting Fixed Range. This enables the Min and Max text boxes and populates them with default values taken from the data set.
-
Select the Min Alpha (default 0%) and Max Alpha (default 100%).
The Alpha variable takes any numeric column and maps the values to their corresponding Alpha values. Consequently, it calculates the values relative position in the domain of the column, and maps that to the same relative position for the domain of the Alpha values.
NOTE:
-
The rendering of the variable is implemented in Java for PDF exporting, and in the Web client. Variables can be created and configured in the Designer, but the visual will not display any Alpha.
-
If an item has an undefined/null value, it will not be drawn.