


|
Reference Line Variable Configuration
You can add a horizontal or vertical line to your chart (for this example, Scatter Plot) to indicate key values, important aggregates or dates, etc. Adding the Y column to a Reference Lines variable can produce this visualization:
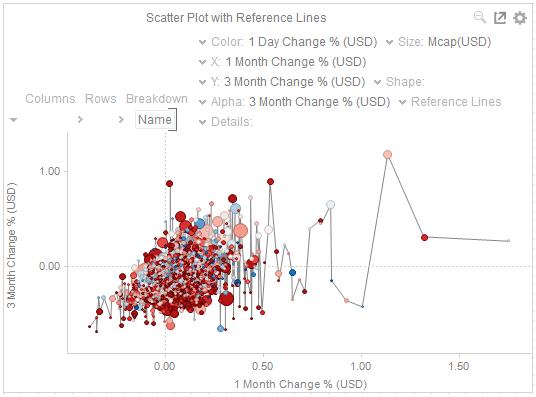
For this sample, after adding the same column used for the Y-axis (3 Month Change % (USD)) as a Reference Line, all of the values on the Scatter plot are then taken and sorted horizontally along the X-axis, then a line is drawn between the values.
The Reference Line variable is available in the Table and all the time series visualizations (except in the Timeseries Surface Plot).
Reference Line Variable Configuration
-
Click the down arrow
 icon
on the left of the Reference Lines variable.
icon
on the left of the Reference Lines variable.
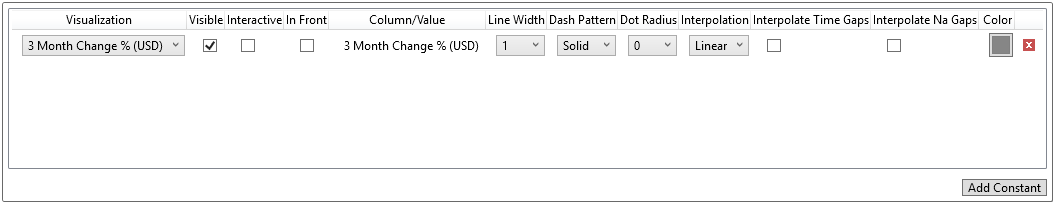
This displays the configuration panel:
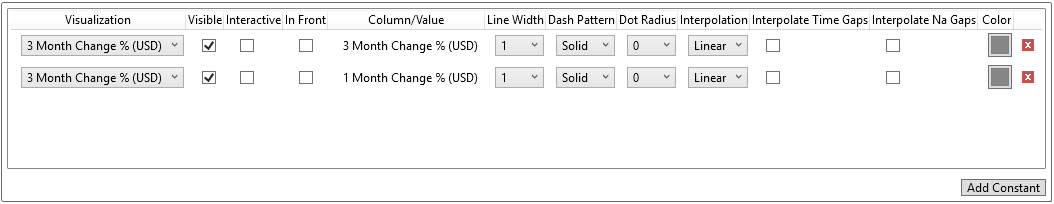
If another column is added to the Reference Lines variable, the configuration panel will look like:
-
Enable the Reference Line of added columns by clicking the Visible box.
-
Enable Interactive to apply the interactive parameters of the column.
-
Enable In Front to display the lines in front of the scatter points.
-
Select the Line Width.
-
Select the Dash Pattern: Dotted, Dashed, or Solid.
-
Select the Dot radius (in pixels) of each data point.
-
Select the line Interpolation Mode: Linear or Stepped.
-
Enable Interpolate Gaps.
-
Click the Color button of an added column to change the line color.
The Color dialog displays.
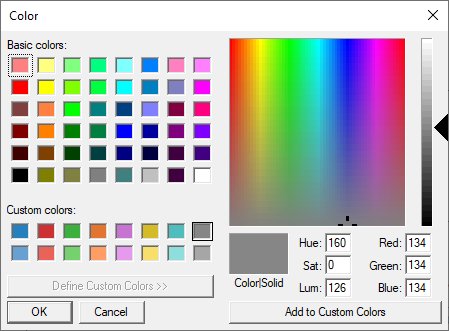
-
Select the desired color and click OK.
-
You can also delete a column by clicking
 .
. -
Click Add Constant. This value (e.g., 100) can be used as point of reference as compared to the column values added in the Y-axis.
You can also perform steps 2 to 12 to the added constants.