RD-E: 1300 Shock Tube Experiment
A shockwave is generated inside a shock tube filled with air and impacts an aluminum plate.
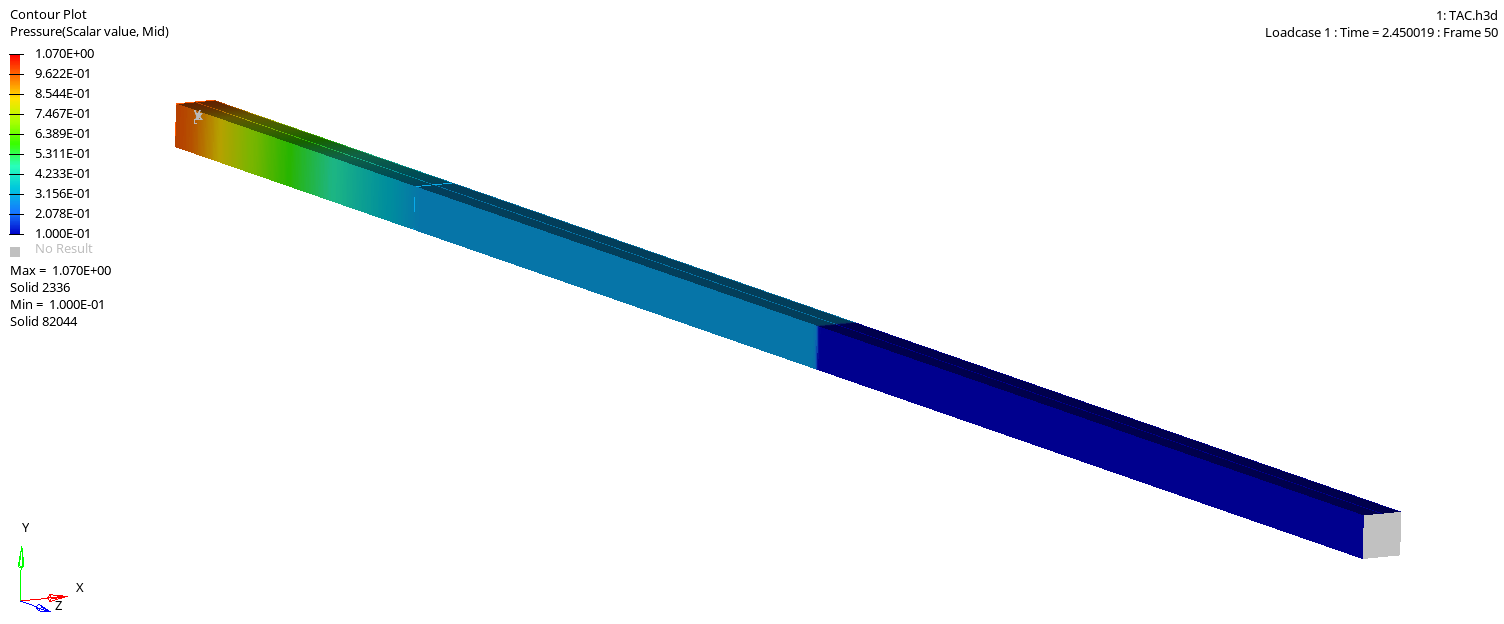
Figure 1.
A shock tube experiment involving blast wave propagation and impact of a shock wave on an aluminum plate is reproduced with Radioss, allowing for a comparison between numerical results and experimental data. The release of compressed air initially confined in the high-pressure section of the tube triggers the formation of a compression shock that propagates into the low-pressure section. Two specific configurations of the shock tube are considered to simulate the propagation of a blast wave in the air and to study the response of an aluminum plate to a shock wave.
Options and Keywords Used
- Fluid material, /MAT/LAW6 (HYDRO or HYD_VISC)
- Multifluid law using the FVM solver, /MAT/LAW151 (MULTIFLUID)
- Ideal gas EOS, /EOS/IDEAL-GAS
- Second-order integration scheme, /ALE/MUSCL (BETA = 2.0, Over-compressive gradient limiter)
- Direct coupling between ALE and Lagrangian elements
Input Files
The input files used in this example include:
<install_directory>/hwsolvers/demos/radioss/example/13_shock_tube/*
Model Description
A shock wave in air is generated inside a shock tube by the release of compressed air initially confined in the high-pressure chamber of the tube.
As the separation between the two sections is removed, a compression shock is formed into the low-pressure region.
The shock tube considered in this example has a square cross-section of 80 x 80 mm. The length of the low-pressure section is 3.18 m.
Two different configurations for the shock tube are considered. They reproduce experimental arrangements 1, allowing for a comparison between the simulation results and experimental data.
Shock Test Configuration
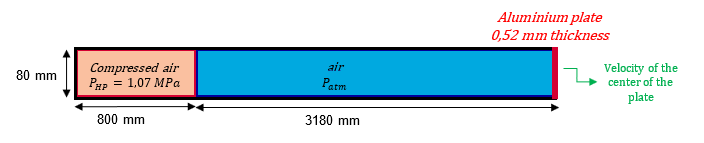
Figure 2. Problem Description of Shock Configuration
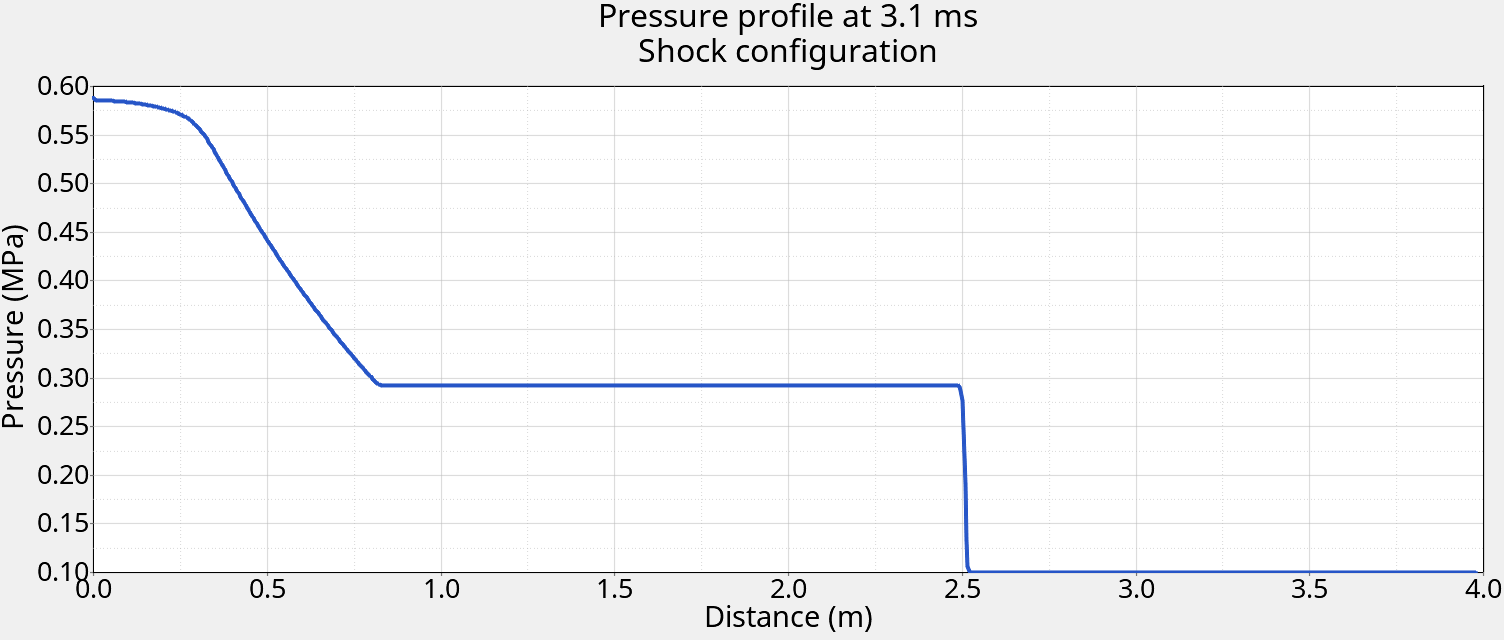
Figure 3. Pressure Profile of the Wave Generated. in shock configuration at 3.1ms
A 0.52 mm thick plate made of Aluminum 5757 H11 is placed at the end of the low-pressure section.
Experimentally, the deformation of the center of the plate is monitored using a heterodyne laser velocimeter that measures the velocity of the center of the plate.
The initial pressure inside the high-pressure chamber is 10.7 bars (1.07 MPa).
Blast Test Configuration
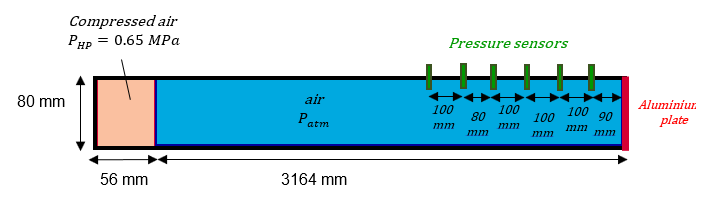
Figure 4. Problem Description for the Blast Configuration
Figure 5. Pressure Profile of the Wave Generated. in blast configuration at 3.1ms
The pressure profile of the wave generated is similar to the blast wave created by the detonation of high explosives in air.
Six piezoelectric pressure gauges are inserted before the end of the tube and capture the evolution of overpressure over time.
In the blast configuration, the pressure inside the high-pressure chamber is 6.5 bar (0.65 MPa).
Model Method
Units: mm, ms, g, N, MPa
Using the symmetry of the problem, only one-quarter of the shock tube is modeled.
- Air
The high and low-pressure sections are contained inside two distinct components.
Compressed air (inside the high-pressure section) and air at atmospheric conditions (inside the low-pressure section) are each modeled with a hydrodynamic fluid law /MAT/LAW6 associated with an ideal gas equation of state (/EOS/IDEAL-GAS), defined with the corresponding physical properties (Table 1).
To activate the final volume solver, each of the hydrodynamic fluid law /MAT/LAW6 is then referenced within a multifluid law (/MAT/MULTILFUID) (MAT ID 10 and 20) with an initial volume fraction of 1. Each multifluid law (/MAT/MULTILFUID) is then associated with the corresponding component.Table 1. Physical Properties to Define Materials Air – High-Pressure Section Air – Low Pressure Section Shock Configuration Blast Configuration Both Pressure P 1.07 MPa 0.65 MPa 0.1 MPa Mass density 13.107E-6 g.mm-3 7.963E-6 g.mm-3 1.225E-6 g.mm-3 Adiabatic exponent 1.4 1.4 1.4 /ALE/MAT should be defined for the /MAT/MULTIFLUID materials, to allow for the transmission of the impulse of the shockwave through the air to the plate.
The /ALE/MUSCL option activates a full second-order integration scheme in time and space. It is added to increase the accuracy of the results.
- Aluminum Plate
The aluminum plate is made of /SHELL elements created at the end of the low-pressure section.
The material law used for aluminum is an isotropic elasto-plastic law (/MAT/LAW2) using the Johnson-Cook material model, and compatible with /SHELL elements. The shell elements use the following properties:- BATOZ formulation
- Ishell = 12
- Full geometric nonlinearities
- Ismstr = 4
- 5 integration points inside the thickness
- N = 5
- Thickness
- t = 0.52mm
All other properties are set to the default values.
- Fluid-structure Coupling
Fluid-structure coupling between air and the plate is done with direct coupling. Coincidental nodes of the ALE and Lagrangian components are merged, and the material velocity of both the fluid and plate at the interface is equal. The displacement of the plate acts as a boundary condition for the fluid, so the air needs to be defined as an /ALE/MATERIAL.
As the model is defined with absolute pressure, a pressure load equivalent to the atmospheric pressure needs to be applied on the other side of the plate. This is accomplished with a pressure load (/PLOAD) applied on the other side of the plate with a value of 0.1 MPa (Figure 6).
- Boundary Conditions
Figure 6. Description of the Shock Configuration ModelAll the boundaries of the fluid domains are sliding walls, which is the default boundary conditions when using (/MAT/MULTIFLUID) material laws.
Boundary conditions applied on the edges of the plate model, the clamping of the plate at the end of the shock tube. These conditions take into account the symmetries of the model, as only a quarter of the plate is actually modeled. (Figure 7).
Figure 7. Boundary Conditions Applied on the PlateA /TH/NODE time history is placed at the center of the plate (Figure 7), to compare its displacement to data. 1
The model for blast configuration is identical to the shock configurations, except the dimensions of the high-pressure section.
/TH/ELEM time histories are created along the tube (Figure 8), to reproduce the experimental configuration of the reference experiment, and compare the numerical results to the pressure profile recorded by pressure gauges. In this example, the deformation of the plate is not studied in this configuration.
Figure 8. Description of the Blast Configuration Model - Engine Control
As of the Radioss 2019.0 release, the time step scale factor for all ALE and EULER elements is set by default to 0.5, but can be modified using the keyword /DT/ALE.
Results
Pressure Profiles in Blast Configuration
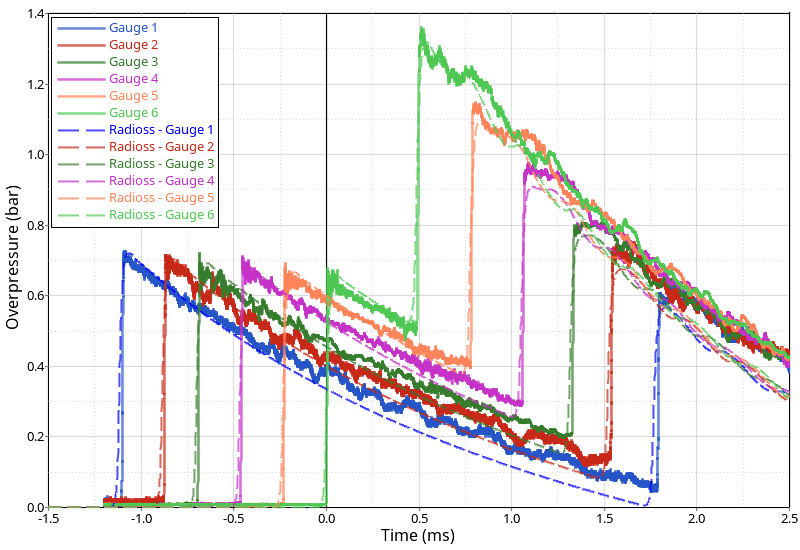
Figure 9. Numerical and Experimental Pressure Profile in the Blast Configuration
Since the model is defined with absolute pressure, the value of atmospheric pressure (0.1 MPa) is included using a negative offset to the numerical results before comparison with the data of the pressure gauges that captures the overpressure.
To synchronize the numerical and test data, the time origin for the experimental data is translated to line up with the arrival of the blast wave on the last pressure gauge.
| Values | Gauge 1 | Gauge 2 | Gauge 3 | Gauge 4 | Gauge 5 | Gauge 6 | Mean |
|---|---|---|---|---|---|---|---|
| Experiment | 770 | 690 | 740 | 730 | 700 | 690 | |
| Radioss | 720 | 704 | 693 | 679 | 666 | 653 | |
| Relative error (%) | 6.5 | 2.0 | 6.4 | 7.0 | 4.9 | 5.4 | 5.3 |
Plate Deformation in the Shock Configuration
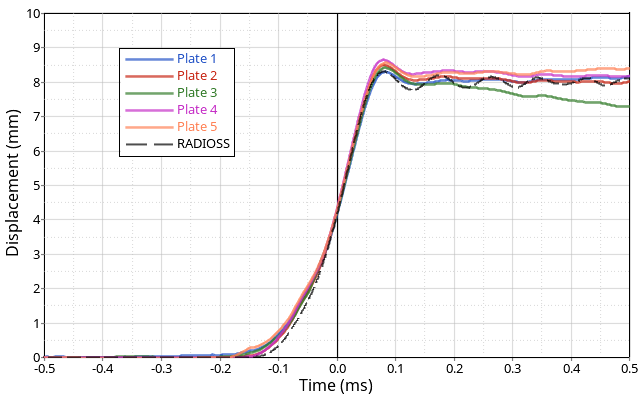
Figure 10. Numerical and Experimental Data for the Deformation. center of the plate in the blast configuration
The experimental values for the deformation of the plate are obtained by integration of the velocity of the center of the plate which was measured using a heterodyne laser velocimeter.
| Values | Plate Thickness | Plate Maximum Deformation |
|---|---|---|
| Experiment | 0.52 | 8.49 |
| Standard deviation | 3% | 2% |
| Radioss | 0.52 | 8.31 |
| Relative error (%) | 2.1 |
The time profile of the deformation of the plate obtained with Radioss, closely matches the experimental profiles. The relative error between the experimental and numerical results for the plate’s maximum deformation is of the same order of magnitude as the standard deviation of the experimental data (0.18 mm – 2%).
Conclusion
The generation of a shock wave in the air inside a shock tube was studied, using a hydrodynamic fluid law /MAT/HYD_VISC with the /MAT/MULTIFLUID multimaterial law to model the air. The option /ALE/MUSCL is also added for more precision. Two different configurations are reproduced, to study the blast wave propagation in air and deformation of a metal plate impacted by a shock wave.
The numerical results are compared to data from experiments. 1
In the blast configuration, both the time profile and maximum overpressure of blast waves are predicted accurately by Radioss.
Results for the deformation of the plate in shock configuration also closely match the experimental data for both the time profile of deformation and maximum value.
The good correlation between numerical and experimental results shows the capability of the Radioss Finite Volume Solver to correctly handle the propagation of blast waves in air, as well as the associated fluid-structure interaction.