This exercise uses the
bullet_local.op2 model file located in the
animation folder.
In this tutorial, you will:
Use the Results Browser to create a vector plot
View vector plots with displacement results
Apply display options for vector viewing
Create and use a Plot Style to be accessed in the Results Browser
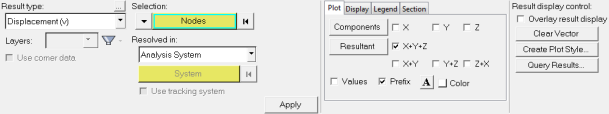
To access the Vector panel:
Click the Vector panel button on the Result toolbar.
OR
Select Results > Plot > Vector from the menu bar.
Figure 1.
The Vector panel allows you to create vector
plots that can be used to display any vector data associated to nodes. Examples
include displacement, velocity, and acceleration.
To access the Results Browser:
Select View > Browsers > HyperView > Results from the menu bar.
Figure 2.
View Vector by Component Direction using the Results Browser
Load the bullet_local.op2 file, located in the animation
folder.
Open the Results Browser by selecting View > Browsers > HyperView > Results from the menu bar.
Expand the Results, Vector, and Displacement folders.
Figure 3.
Note: The three components, as well as the magnitude, are listed
under the Displacement folder.
Click on the vector icon next to
Displacement.
A vector plot is applied to the model in the graphics area.
Figure 4.
Changing the Vector Plot Settings Using the Vector Panel
Click the Vector panel button on the Result toolbar
to enter the Vector panel.
Using the Vector panel, additional options can be changed and applied to the
vector plot.
Figure 5.
Select Displacement (v) as the Result type.
Activate the check boxes for the X,
Y, and Z components, and
uncheck the X+Y+Z check box.
Verify that Selection is set to Nodes.
Change the Resolved in system type from Analysis System to Global
System.
Click on the Display tab and specify the
following:
For Size scaling, select Uniform from the
drop-down menu and set the value to 1.
For Color by, select Direction from the
drop-down menu.
Select nodes by either of the following methods:
In the graphics area, pick a few nodes on the model.
OR
Use the quick window selection mode. Press the Shift key and the left
mouse button, and drag the mouse in the graphics area, to draw a window
over a specific area of the model.
OR
Select nodes by collector type.
Figure 6.
Click Apply (if necessary).
Figure 7. Vectors Based on Direction
View Vector by Values
From the Display tab, select Value for Color by.
Figure 8. Color Vectors Based on Value
Click on the Plot tab and deselect the individual check
boxes for X, Y, and Z.
Next, activate the X+Y+Z check box.
The vectors are displayed in resultant direction and their value corresponds
to the colors in the legend.
Figure 9.
Activate the Show values check box.
The value of the vectors are displayed in the graphics window along with
the vectors.
Uncheck the Show values check box.
Create and use a Plot Style
Click the Create Plot Style button.
Creating a plot style allows you to save the current settings in the
Vector panel so that they can be accessed later in the Results Browser.
In the Create/Update Vector Plot Style dialog, enter
Global Uniform in the New plot style text field and
click OK.
Figure 10.
In the Results Browser, expand the Plot Styles folder.
Note: Global Uniform is now listed as a plot style.
Figure 11.
Click on the icon next to Default Vector (under Plot Styles) to create a vector
plot with displacement results using the default vector plot style.
A vector plot is applied to the model with displacement results that are
Resolved in the Analysis System and are being sized using the Auto option.
Figure 12.
Click on the Global Uniform plot style icon to return to
the previous vector plot settings (which were saved to this Plot Style).
The displacement results are now being Resolved in the Global System and are
being shown in a Uniform size. Figure 13.
Click Clear Vector in the Vector panel to remove the
vector plot.
 on the Result toolbar.
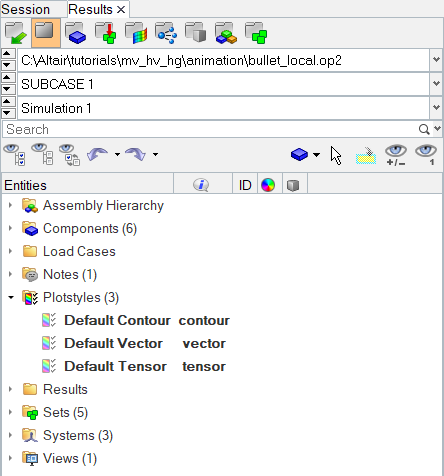
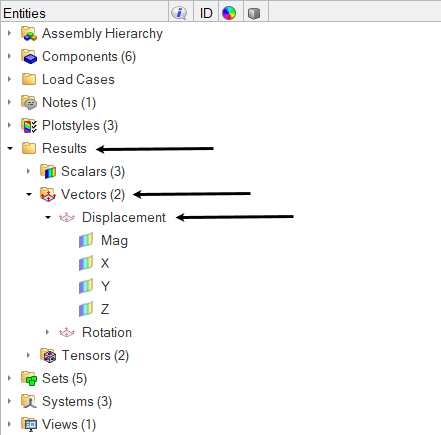 Figure 3. Note: The three components, as well as the magnitude, are listed under the Displacement folder.
 next to
Displacement.
A vector plot is applied to the model in the graphics area.
next to
Displacement.
A vector plot is applied to the model in the graphics area.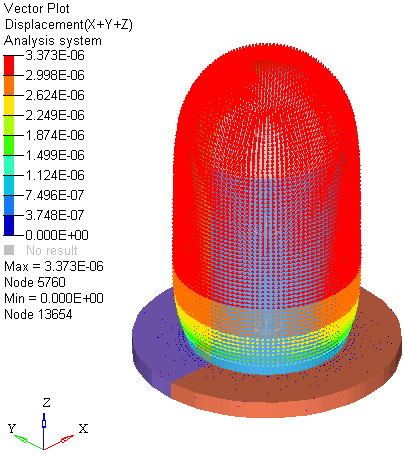 Figure 4.
  on the Result toolbar
to enter the Vector panel.
Using the Vector panel, additional options can be changed and applied to the vector plot.
on the Result toolbar
to enter the Vector panel.
Using the Vector panel, additional options can be changed and applied to the vector plot. Figure 5.
 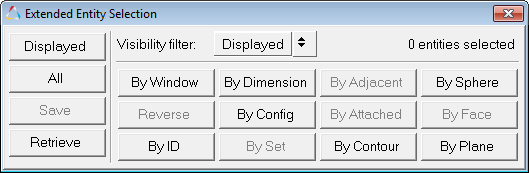 Figure 6.
 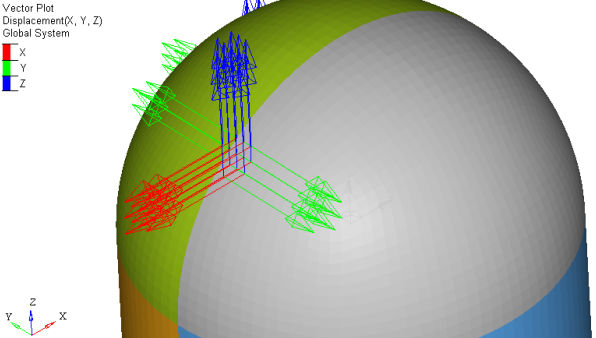 Figure 7. Vectors Based on Direction
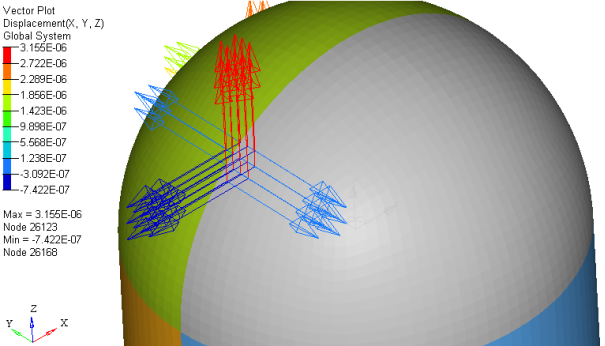 Figure 8. Color Vectors Based on Value
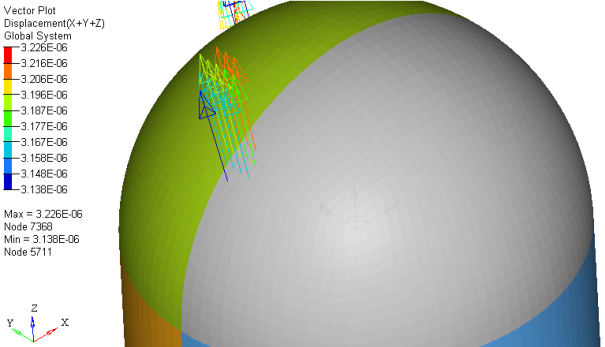 Figure 9.
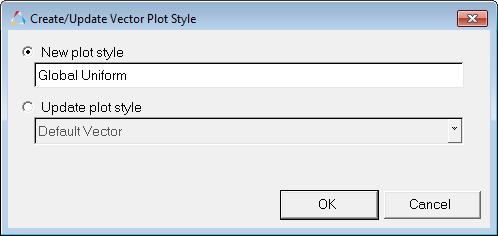
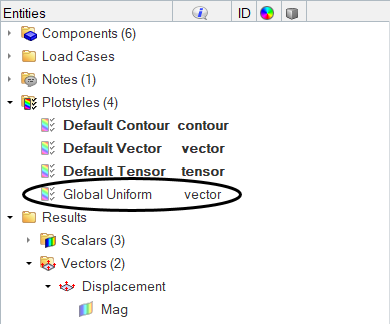 Figure 11.
 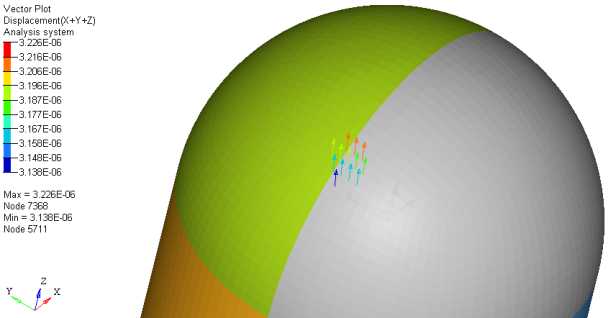 Figure 12.
 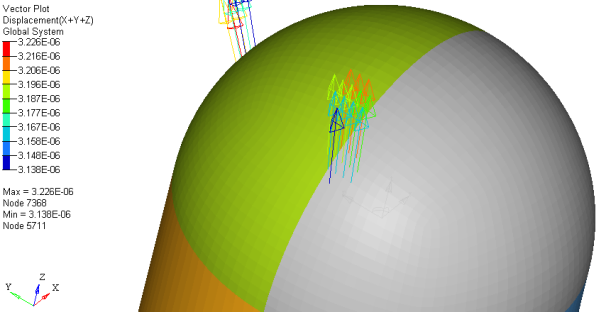 Figure 13.