HV-3020: View Iso Values
Learn how to view iso values.
- View multiple iso values in the Contour panel
- View a single iso value in the Iso panel using Contour panel settings
- View iso values using displacement results
- Click the Iso panel button
 on the Result toolbar.
 OR
- Select from the menu bar.
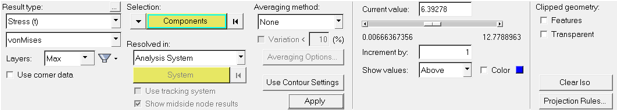
Figure 1.
The iso surfaces can be viewed from the Contour panel as well as the Iso panel. Choosing Show Iso Value from the Contour panel will allow you to view the iso surfaces according to the contour legend settings for the applied result type. On the other hand, the Iso panel allows you to automatically mask elements based on a user defined value for the result type that is applied in the panel. By using the option Use Contour Settings in the Iso Panel, you can view the iso surfaces for the results as applied in the Contour panel.
Viewing Iso Surfaces from the Contour Panel.
-
Click the Contour panel button
 on the Result toolbar
to enter the Contour panel.
on the Result toolbar
to enter the Contour panel.
-
Click Apply.
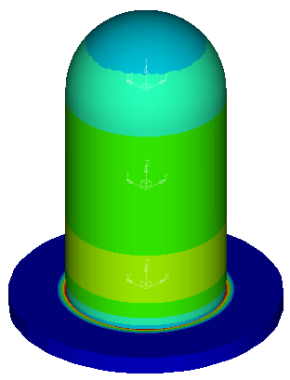 Figure 2.
 -
Click Show Iso Value to view the iso surfaces while
remaining in the Contour panel.
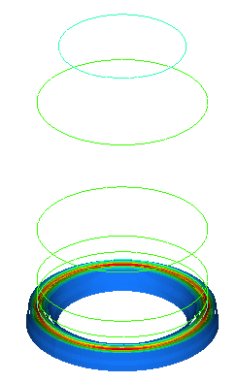 Figure 3.
Viewing Iso Surfaces in the Iso Panel using Contour Settings
After you have created a contour of a model, you can view a single iso surface in the Iso panel.
-
Click the Iso panel button
 from the Result
toolbar to enter the Iso panel.
from the Result
toolbar to enter the Iso panel.
-
Click Apply.
 Figure 4.
 Show the model above the iso values and adjust the view using the slider bar.
View Iso Values using Displacement Results
-
For Current Value enter 2.468e-06 and press
ENTER.
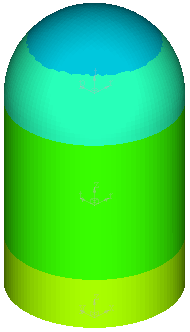 Figure 5.
 You are viewing the contour in stresses, however the iso is operated using displacements. The movement of the slider bar is controlling the displacement result values while the stresses are displayed on the iso surfaces.
View Iso Values on Specified Components
-
Enter the values 4, 6 in the text box and click
Add.
The By ID dialog will show that two entities have been added to the selection (in the upper right corner).
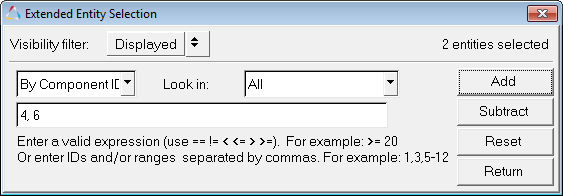 Figure 6.
 -
Update the Current Value to 2.468e-06 and press
ENTER.
Note: The iso value plot is only applied to the selected components.
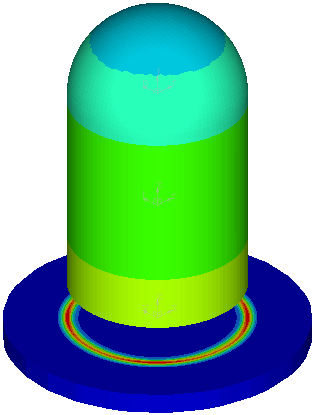 Figure 7.