This exercise uses the
bullet_local.op2 model file located in the
animation folder.
In this tutorial, you will:
Use the Results Browser to create a tensor plot
Plot and view tensors
Select a projection rule for stress transformation and averaging to
nodes
Create and use a Plot Style to be accessed in the Results Browser
To access the Tensor panel:
Click the Tensor panel button on the Result toolbar.
OR
Select Results > Plot > Tensor from the menu bar.
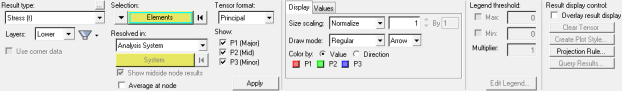
Figure 1.
The Tensor panel allows you to view tensor
plots of stress and strain directions and magnitudes from elemental values.
To access the Results Browser:
Select View > Browsers > HyperView > Results from the menu bar.
Figure 2.
Viewing Tensors in the Analysis System Using the Results Browser.
Load the bullet_local.op2 file, located in the animation
folder.
Open the Results Browser by selecting
ViewBrowsersHyperViewResults
from the menu bar.
Expand the Results and Tensor folders.
Figure 3.
Click on the tensor icon next to Stress.
A tensor plot of stress is applied to the model in the graphics
area.Figure 4.
Changing the Tensor Plot Settings Using the Tensor Panel
Click the Tensor panel button on the Result toolbar to enter the Tensor panel.
Using the Tensor panel, additional options can be changed and applied to the
tensor plot. Figure 5.
Click in the graphics area and press M on the keyboard
to display the mesh.
For Result type select Stress (t).
For Layers select Z1.
Verify that Selection is set to Elements for the active entity type.
Verify that Resolved in is set to Analysis System.
Change the Tensor format to Component.
Under Display options, verify that Size scaling is set to
Normalize.
Verify that Color by is set to Value, to view the tensors by values.
Select elements either by collector type or pick them directly from the screen
using the quick window selection mode.
Figure 6. Figure 7.
Select Color by: Direction and view the direction of the
vectors.
The legend changes to a category legend to reflect the colors of the
directions.Figure 8.
Viewing Tensors in the Global System
Change Resolved in to Global System (proj: none).
Select a projection rule to calculate in-plane stresses.
Click Projection Rule.
Select Projection (use projected axis as Sxx) to
activate the axis options.
The projection rule status is designated next to the coordinate system
type in the Resolved in drop-down menu. By default, no projection rule
is applied.
For the primary axis, select the axis you want to project to the plane
of the shell elements.
There are six possible combinations of axes.
If the primary axis is
normal to the shell plane, the secondary axis is automatically
used.
Click OK to accept the settings and close the
dialog.
Click Apply to transform all the stress tensors to the
global direction using the projection rule.
Figure 9.
Activate Average at node.
Click Apply to average the stress tensor to the
nodes.
Observe that the vectors are located at the nodes.Figure 10.
Create and use a Plot Style
Click the Create Plot Style… button.
Creating a plot style allows you to save the current settings in the Tensor
panel so that they can be accessed later in the Results Browser.
In the Create/Update Tensor Plot Style dialog, enter
Global proj: x,y in the New plot style text field and
click OK.
Figure 11.
In the Results Browser, expand the Plot Styles folder.
Note: Global proj: x,y is now listed as a plot style.
Figure 12.
Click on the icon next to Default Tensor (under Plot Styles) to create a tensor
plot with stress results using the default tensor plot style.
A tensor plot is applied to the model with stress results that are
Resolved in the Analysis System with no projection rule.Figure 13.
Click on the Global proj:x,y plot style icon to return
to the previous tensor plot settings (which were saved to this Plot
Style).
The stress results are now being Resolved in the Global System and the
x,y projection rule is being used. Figure 14.
Click Clear Tensor in the Tensor panel to remove the
vector plot.
 on the Result toolbar.
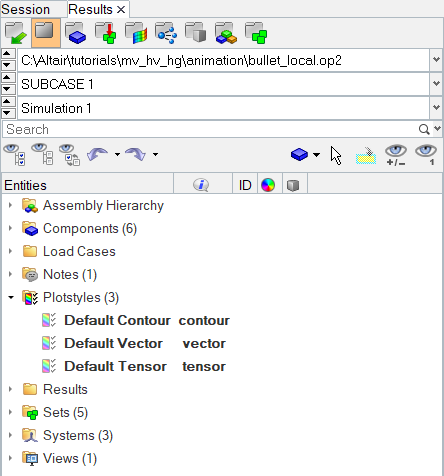
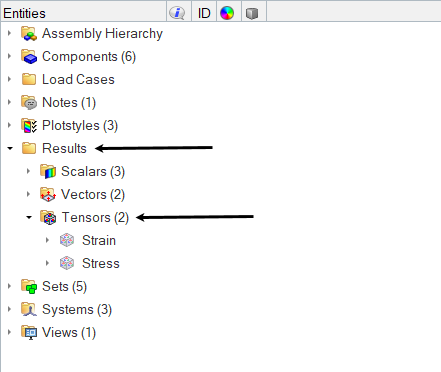 Figure 3.
  next to Stress.
A tensor plot of stress is applied to the model in the graphics area.
next to Stress.
A tensor plot of stress is applied to the model in the graphics area.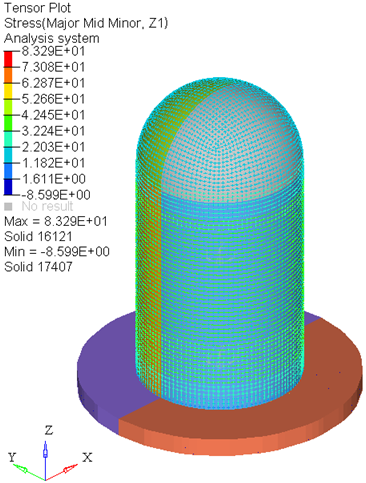 Figure 4.
  on the Result toolbar to enter the Tensor panel.
Using the Tensor panel, additional options can be changed and applied to the tensor plot.
on the Result toolbar to enter the Tensor panel.
Using the Tensor panel, additional options can be changed and applied to the tensor plot.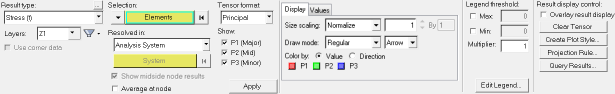 Figure 5.
 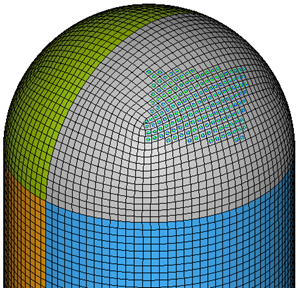 Figure 6.
 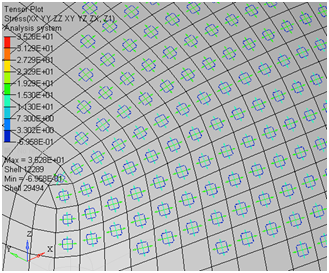 Figure 7.
 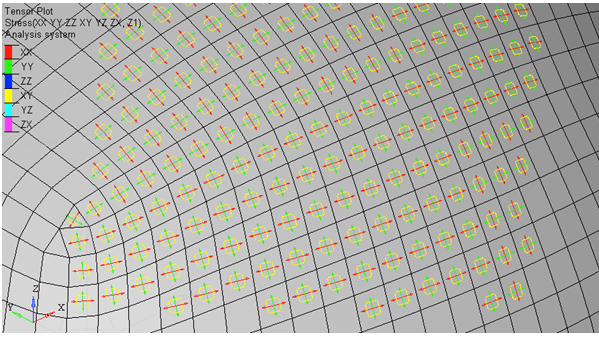 Figure 8.
 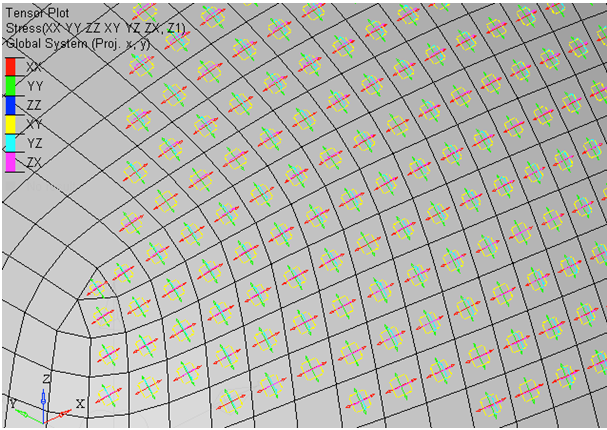 Figure 9.
 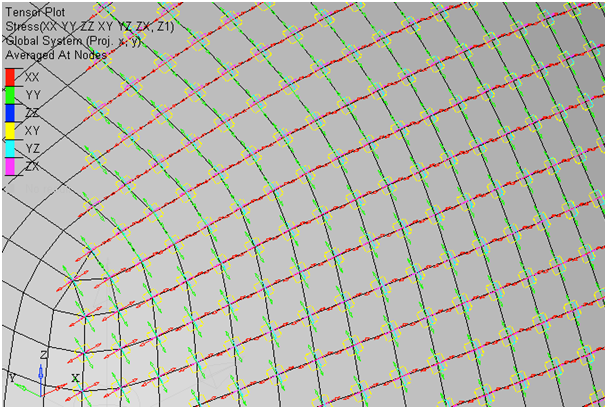 Figure 10.
 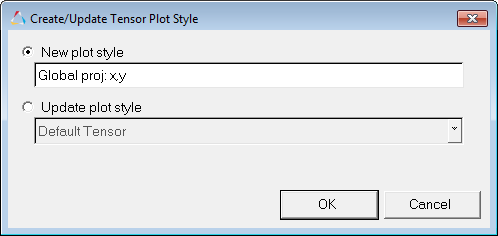 Figure 11.
 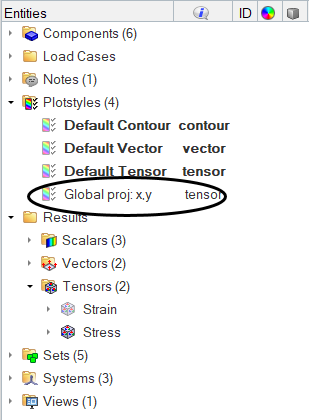 Figure 12.
 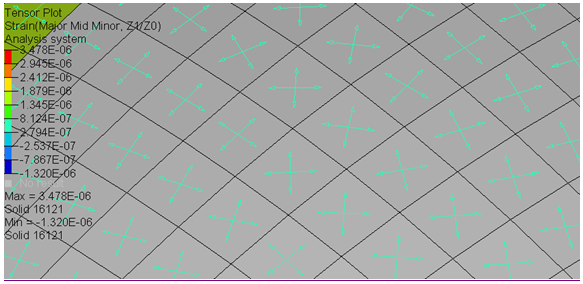 Figure 13.
  Figure 14.