Learn how to generate cross sections for contour plotting of flow variables (for
example, velocity or pressure) and generate streamlines starting from a surface or
line.
This exercise uses the ensightb.case results file located in
the animation folder.
To access the Streamlines panel:
Click the Streamlines panel button on the Result toolbar.
OR
Select Results > Plot > Streamlines from the menu bar.
Figure 1.
The Streamlines panel allows you to generate
streamlines using any available nodal vector field (typically a velocity field).
Velocity fields are directly written to H3D files by many solvers such as: Radioss, HyperXtrude, Moldflow, etc. Velocity fields and
other scalar and vector data fields are also saved in EnSight format by most CFD
solvers.
Create Multiple Section Cuts and Contour the Model
Load the ensightb.case file, located in the animation
folder, as both the model and results files.
Figure 2.
Right-click within the Results Browser and select Create > Section Cut > Planar. Then right-click on Section 1 and select
Edit.
A section cut is automatically applied to the model, and the Section Cut
panel is displayed.
Verify that Define plane is set to Y Axis.
Under Display Options, turn on the Cross section option
and verify that the Width is set to the lowest value.
Figure 3.
Note: You can use the Define plane slider bar (located under the Y Axis
button) to move the position of the section cut.
Click the Contour panel button on the Result toolbar.
Select UVW(v) as the Result type and click
Apply.
Figure 4.
Within the Results Browser, expand the Section Cuts folder, right-click on
Section 1, and select Edit.
You are returned to the Section Cut panel.
Click the Add button.
Select Z Axis for the plane and click
Apply.
Figure 5.
Deactivate the section cuts by removing the check marks from their respective
check boxes.
Note: If the section cuts are not deactivated, the streamlines will also be cut
and you would only be able to see the points where the streamlines hit the
cross section.
Return to the Contour panel .
Click the Clear Contour button.
Note: If the contours are not cleared, all of the streamlines would appear gray
and they would not be colored according to the contour variable.
Create a 'Line' Streamline
Using the Results Browser, turn off the display of the following components:
BC3_wall (ID 7), cells of cell type
1 (ID 1), and cells of cell type 2 (ID
2), so that the inside of the flow domain is displayed in the graphics
area.
Figure 6.
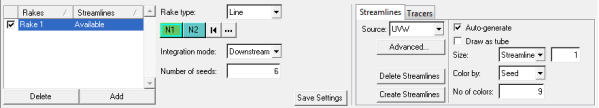
Click the Streamlines panel button from the Result toolbar to enter the Streamlines
panel.
Click Add, to add a new set of streamlines.
Select Line as the Rake type.
Specify N1 and N2 by picking two
nodes on the BC1_inlet (ID 4) component on the model.
Select Downstream from the Integration mode drop-down
menu.
Enter 10 into the Number of seeds text box.
Click the Create Streamlines button (located within the
Streamlines tab on the right side of the panel).
Figure 7.
From the Streamlines tab, activate the Draw as tube
option.
Select Streamline from the Size drop-down menu and
change the value in the text box from 1 to 7.
Click the Create Streamlines button.
Figure 8.
Create an 'Area' Streamline
Add another streamline.
Select Area as the Rake type.
Select the BC1_inlet (ID 4) component on the
model.
Select Downstream for the Integration mode.
Specify the Number of seeds as 40.
Click Create Streamlines.
Figure 9.
Click the Contour panel button on the Result toolbar.
Select UVW(v) as the Result type and click
Apply.
Rotate the model and view the streamlines with the contour applied.
 on the Result toolbar.
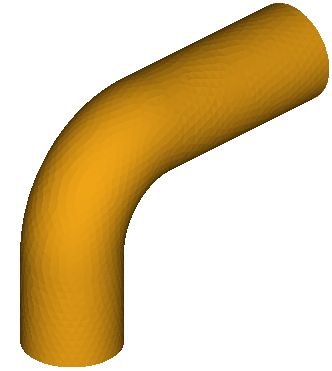 Figure 2.
 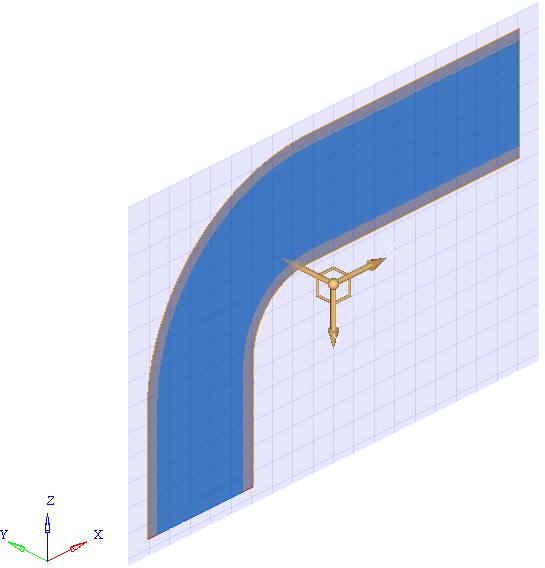 Figure 3. Note: You can use the Define plane slider bar (located under the Y Axis button) to move the position of the section cut.
 on the Result toolbar.
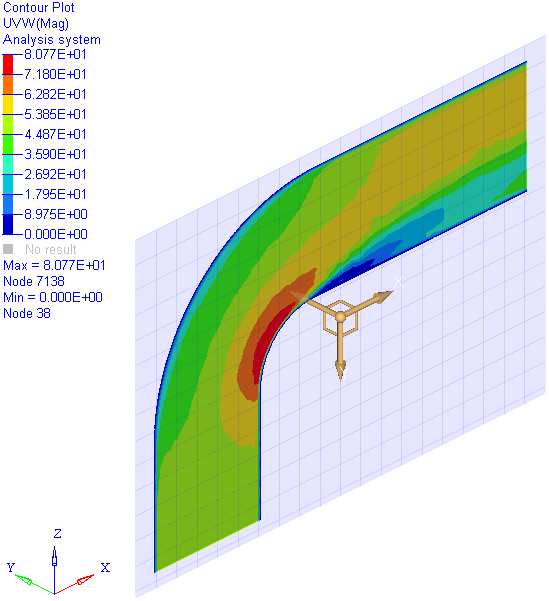 Figure 4.
 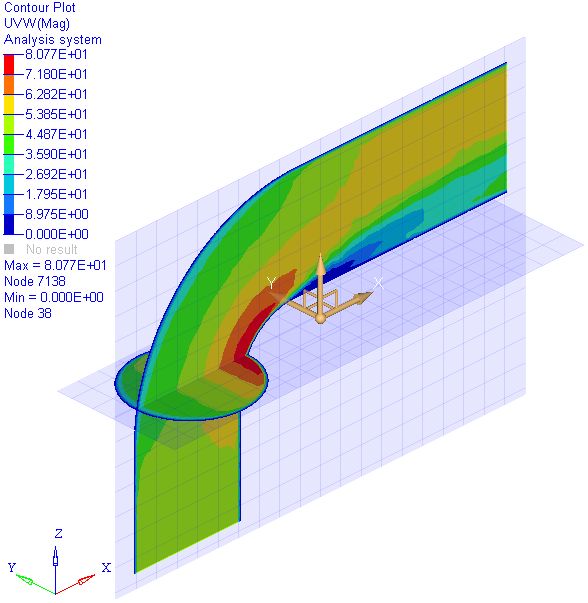 Figure 5.
 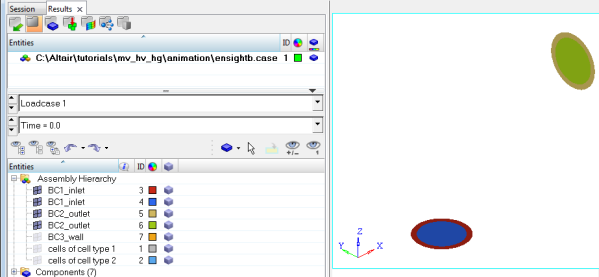 Figure 6.
  from the Result toolbar to enter the Streamlines
panel.
from the Result toolbar to enter the Streamlines
panel.
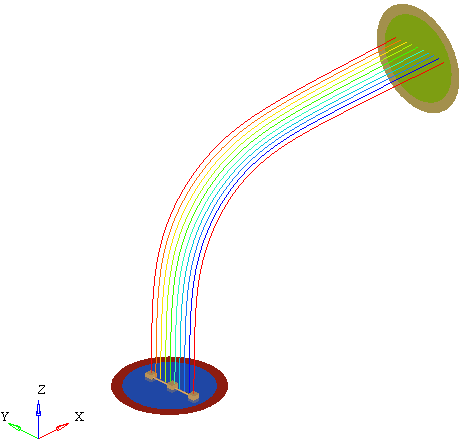 Figure 7.
 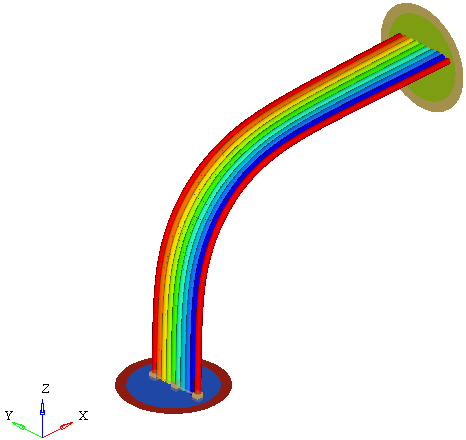 Figure 8.
 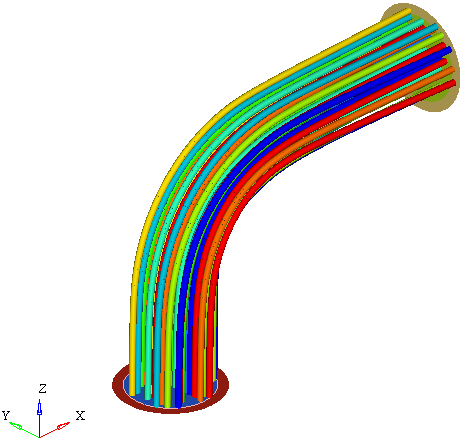 Figure 9.
 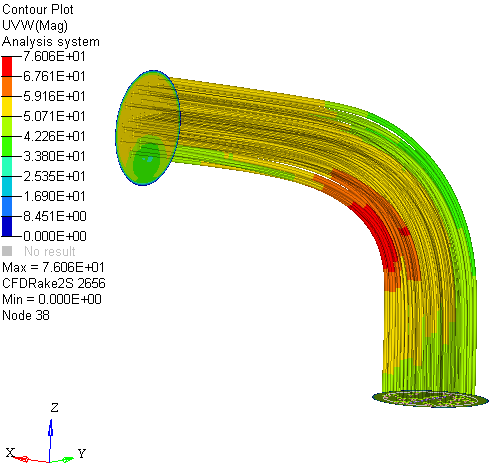 Figure 10.