This exercise uses the ALE_tank.h3d
model file located in the animation folder.
In this tutorial, you will learn how to:
View results on special elements such as ALE using a combination of HyperView tools and settings such as:
Results Contour
Iso Values
Section Cut
Grid Line
Transparency
Feature Lines
To access the Iso panel:
Click the Iso panel button on the Result toolbar.
OR
Select Results > Plot > Iso from the menu bar.
Figure 1.
The Iso panel is generally used to display
single iso values (iso surfaces for solids or iso line for shells) dependent on the
results data.
Make the Solid Elements Transparent
Load the ALE_tank.h3d file, located in the animation
folder, as both the model and results files.
This model contains a Tank, partially filled with Water and air. The tank is
clamped with a bracket. The tank and the bracket are shell meshed and have
metallic materials. The whole assembly is surrounded by outer air. All the
fluids in the model (air and water) are meshed in the form of Solid ALE
mesh.
Densities:
Water:
1.067 e-6 kg/mm3
Air inside the tank:
1.09 e-9 kg/mm3
Figure 2.
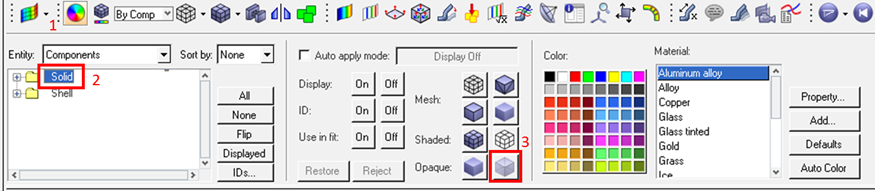
Since the shell components are hidden inside the solid mesh, to make the solid
mesh transparent, click the Entity Attributes panel
button on the Visualization toolbar to
enter the panel.
Select Solid from the list of entities and click the
button for transparency.
Figure 3. Figure 4.
Contour a Result for Comparison Between Fluids
To contour the density results, click the Contour panel button on the Result
toolbar.
The Contour panel is displayed.
Under Result type, use the drop-down menus to select ALE
Results and Fluid Density.
Select Simple as the Averaging Method.
Click Apply.
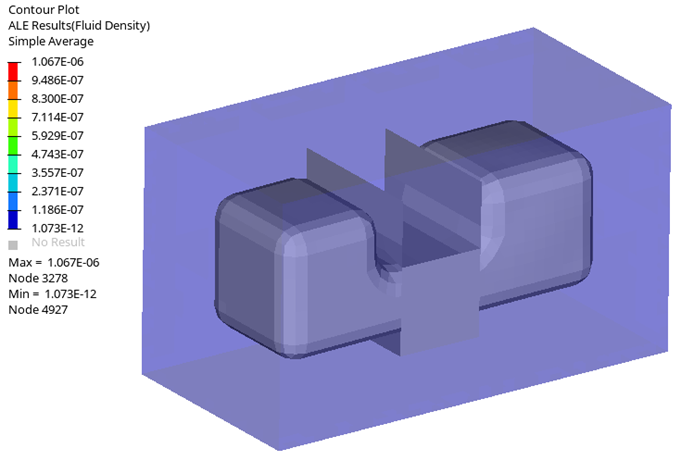
Figure 5.
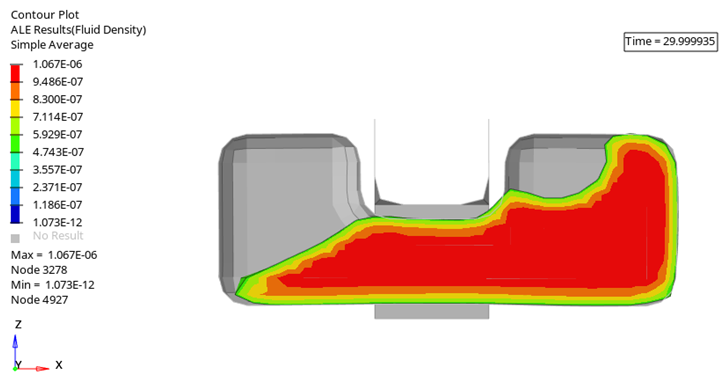
The graphics area displays the fluid density for all the fluids with outer
air at default density values.
The water and air inside the tank are hidden
and therefore cannot yet be seen.
Figure 6.
Create a Section Cut
Right-click in the Results Browser and select Create > Section Cut > Planar from the context menu.
A section cut is automatically applied to the model.
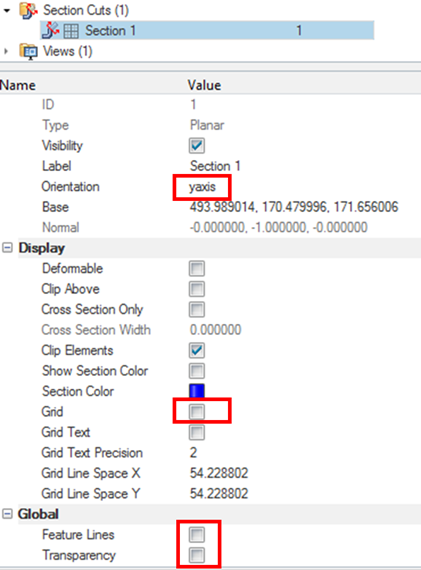
Right-click on Section 1 and select
Edit.
The Entity Editor is displayed and shows the options available for Section
1.
Verify that Define plane is set to Y Axis.
For a better view, turn off the Grid option.
Optional: You can also choose to select options such as Cross Section
only, Feature Lines, and
Transparency.
Figure 7.
To hide the Section cut manipulator, click anywhere in the blank (white) space
inside the Results Browser, or right-click on Section 1
in the Results Browser and select Hide Manipulator.
Click on the XZ Left Plane View button from the toolbar.
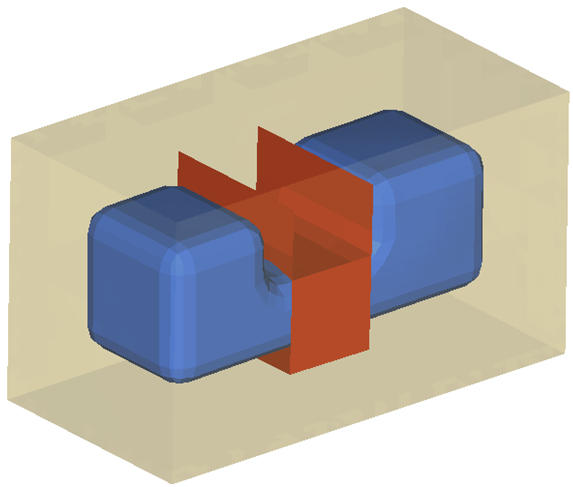
This layout will give you a better picture of how the fluids are located. You
can choose to play the animation to see the overall movements of the fluids. Figure 8.
The above display gives a combined view of all the fluids in the model.
To
focus on Water inside the tank, the Iso Tool can be
used effectively.
Create an Iso Plot
Click the Iso panel button from the Result
toolbar to enter the Iso panel.
Tip: You can also right-click on the Legend and click Iso > Add Plot.
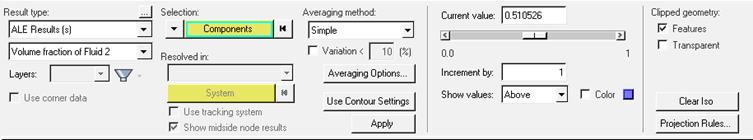
To isolate the results for Water (Fluid 2), under Result type select
ALE Results (s) and Volume fraction of
Fluid 2.
Select the ALE components only, which in this case is Component ID 3098
"Air_out".
Select Simple as the Averaging Method.
Click Apply.
Verify that the Iso Current value is set at ~0.5.
Figure 9. Figure 10.
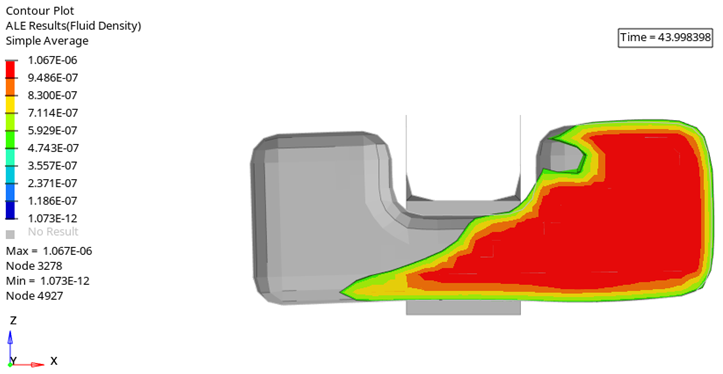
This will result in a Fluid Density Contour with a volume fraction of water >
0.5.
Try Iso plots for Volume fractions of different fluids or other ALE
results.
Optional: Switch on/off the Features and
Transparent options for a variety of views.
Explore Other Views
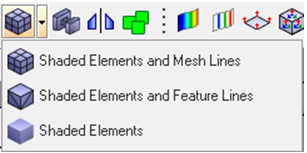
For reporting purposes, you can also try changing the shading properties of the
elements using the button and different options on
the Results toolbar.
Figure 11.
Note: Transparency gets switched off for solids when you try the above shading
styles of elements. Please follow Step 1 of this tutorial when you need to
switch on the transparency.
Also try switching on/off the Features and
Transparent options in the Iso panel for a variety of
views. Refer to Step 4.8.
Figure 12.
Tip: You can also consider hiding the contour by using the Display
Control Menu on the Display Toolbar.
 on the Result toolbar.
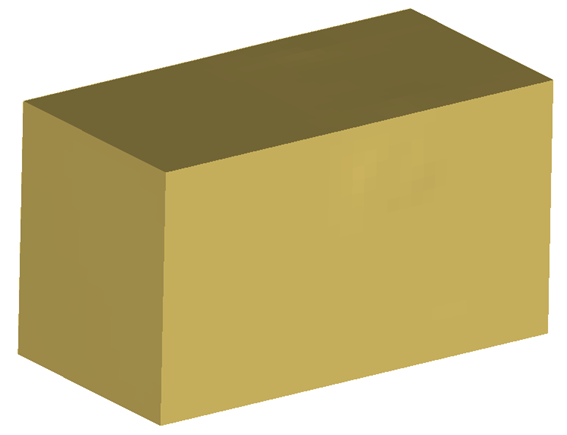
 on the Visualization toolbar to
enter the panel.
on the Visualization toolbar to
enter the panel.
 button for transparency.
 on the Result
toolbar.
The Contour panel is displayed.
on the Result
toolbar.
The Contour panel is displayed.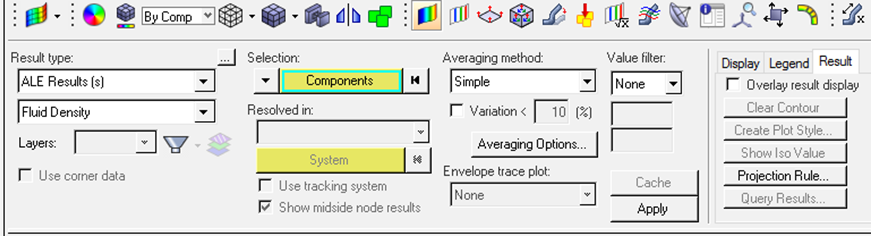
 from the toolbar.
This layout will give you a better picture of how the fluids are located. You can choose to play the animation to see the overall movements of the fluids.
from the toolbar.
This layout will give you a better picture of how the fluids are located. You can choose to play the animation to see the overall movements of the fluids.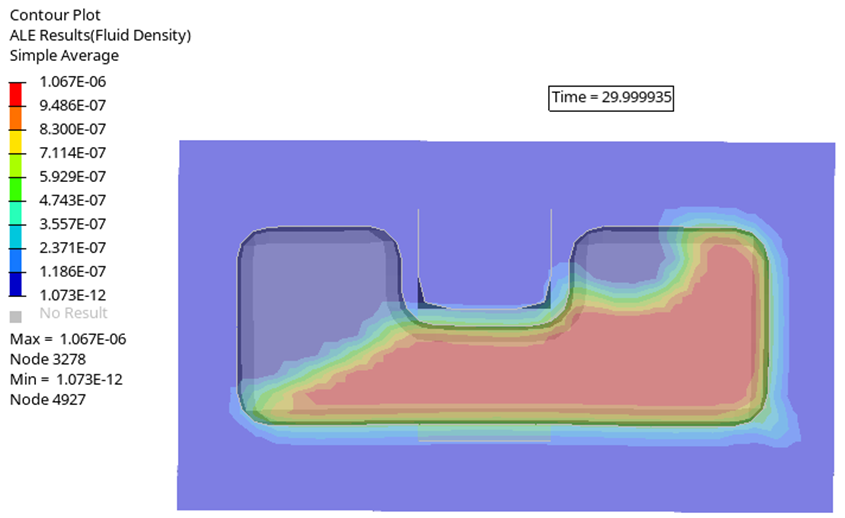
 from the Result
toolbar to enter the Iso panel.
Tip: You can also right-click on the Legend and click .
from the Result
toolbar to enter the Iso panel.
Tip: You can also right-click on the Legend and click .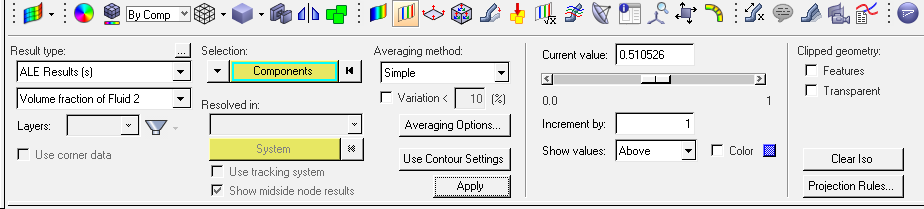
 button and different options on
the Results toolbar.
button and different options on
the Results toolbar.
 on the Display Toolbar.