|
Cross Tabbing
Cross tabbing produces a matrix of smaller linked visualizations, which each show a subset of the parent data set, displaying the joint distribution of two or more variables that do not exist within a hierarchy.
Cross tabbing is also known as trellising, latticing, and small multiples, although the purpose is the same in each case. Panopticon Designer (Desktop) displays cross tabbed visualizations in order to allow trends and outliers to be more easily seen, by enforcing comparison of changes, similarities and differences among displays.
Cross tabbing is available in the following visualizations:
Cross Tabbing
-
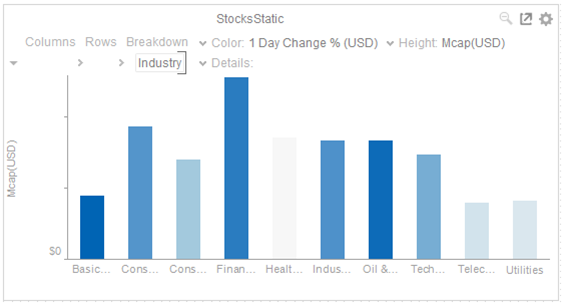
Select an existing visualization that supports cross tabbing like a Bar Graph.
-
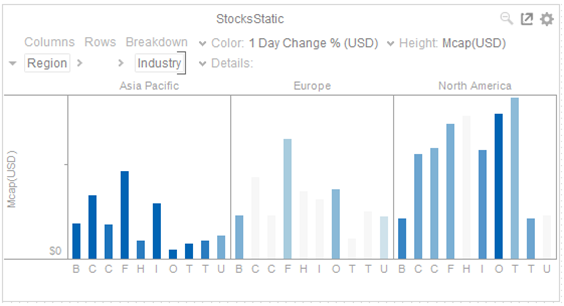
Drag a column onto the cross tab columns drop point to trellis the visualization horizontally.
-
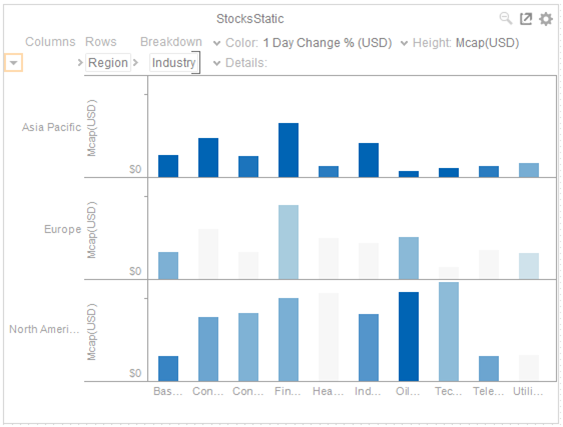
Drag a column onto the Cross tab Rows drop point to trellis the visualization vertically.
-
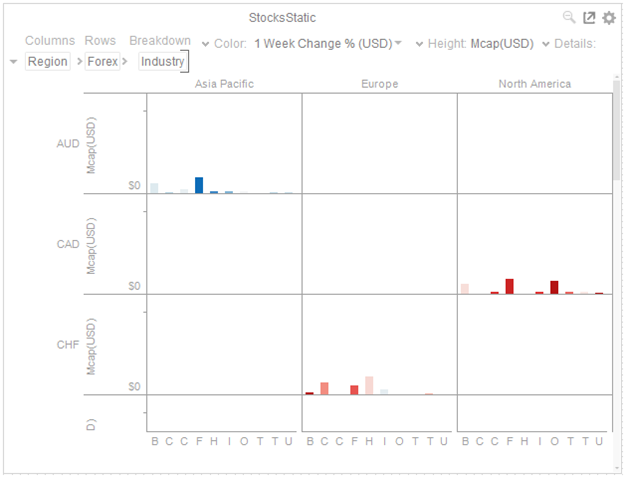
Drag multiple columns onto the cross tab drop points to both produce hierarchical cross tabs, and tabular cross tabs, where the visualization is divided by both rows and columns.