Add
Creates the curve on the given plot's page.
Syntax
<Curve Editor Object> Add {<optional> args}
Description
Add takes arguments as name-value pair arguments. The number of curves added is based on the number of y expressions/lists provided.
Arguments
- args
- Various arguments to be passed as a -name value pairs.
- x
- List of x coordinates/x expression.
- y
- List of y coordinates/y expression.
- category
- List of x categories (only for bar chart).
- visibility
- Change the visibility of the curve.
- showlabelprefix
- Show/hide the label prefix.
- labelprefix
- Label prefix of the curve.
- showlabel
- Show/hide the name.
- label
- Name of the curve.
- showlabelsuffix
- Show/hide the label suffix.
- labelsuffix
- Label suffix of the curve.
- linestyle
- Line style index. Same index as shown in the property editor (0-indexed).
- linecolor
- Color index. Same index as shown in the property editor (0-indexed).
- linethickness
- Line thickness index. Same index as shown in the property editor (0-indexed)
- shadearea
- Turn on/off shading.
- symbolstyle
- Symbol style for coordinates. Same index as shown in the property editor (0-indexed).
- symbolcolor
- The index of the color to be used for the symbol style (0 indexed).
- symbolfrequency
- Symbol frequency of the curve.
- symbolsize
- Sets the symbol thickness of the curve.
- barstyle
- Change bar style (only applies to the bar type plot).
- barcolor
- Changes the bar color (only applies to the bar type plot).
Returns
The list of curve IDs created.
Example
toplevel .top
set editor [::hw::CurveEditor .top.fr]
# list for both coordinates
$editor Add -x [list 0 1 2 3 4 5] -y [list 0 2 4 9 16 25] -shadearea true
# list for x, expression for y
$editor Add -x [list 0 1 2 3 4 5] -y 3*x^2 -label “square(x)”
# expressions for both
$editor Add -x 0:5:0.1 -y 50*sin(x) -y 50*cos(x) -linethickness 2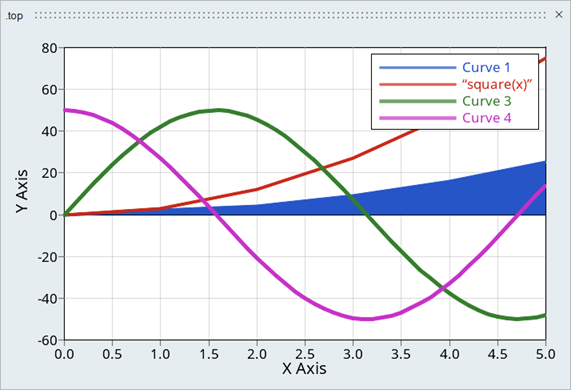
Figure 1.
$editor SetType bar
$editor Add -category [list Jan Feb Mar Apr] -y [list 10 15 30 52 26] -y 0:25:5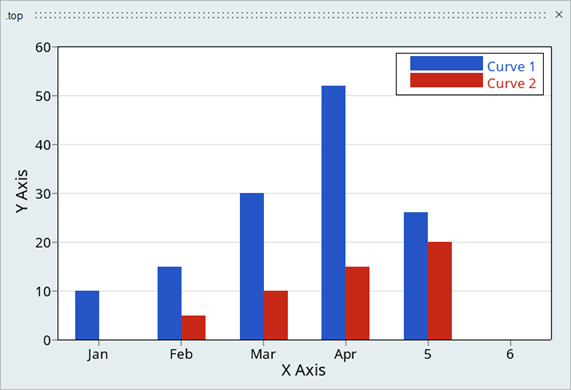
Figure 2.