Well Plot
The Well Plot tool cross plots MD, TVD, etcetera, against one or more results along the well depth typically obtained using the mapping tool.
-
Select the Well Plot tool from the Select GeoD Tool dropdown list.
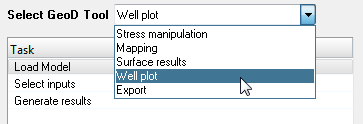 Figure 1.
 -
Click on the file browser button
 adjacent to the Load Model field and browse and select the
demo-map.h3d file and click Open.
adjacent to the Load Model field and browse and select the
demo-map.h3d file and click Open.
-
Click Apply.
The model and result files are loaded in the HyperView window.
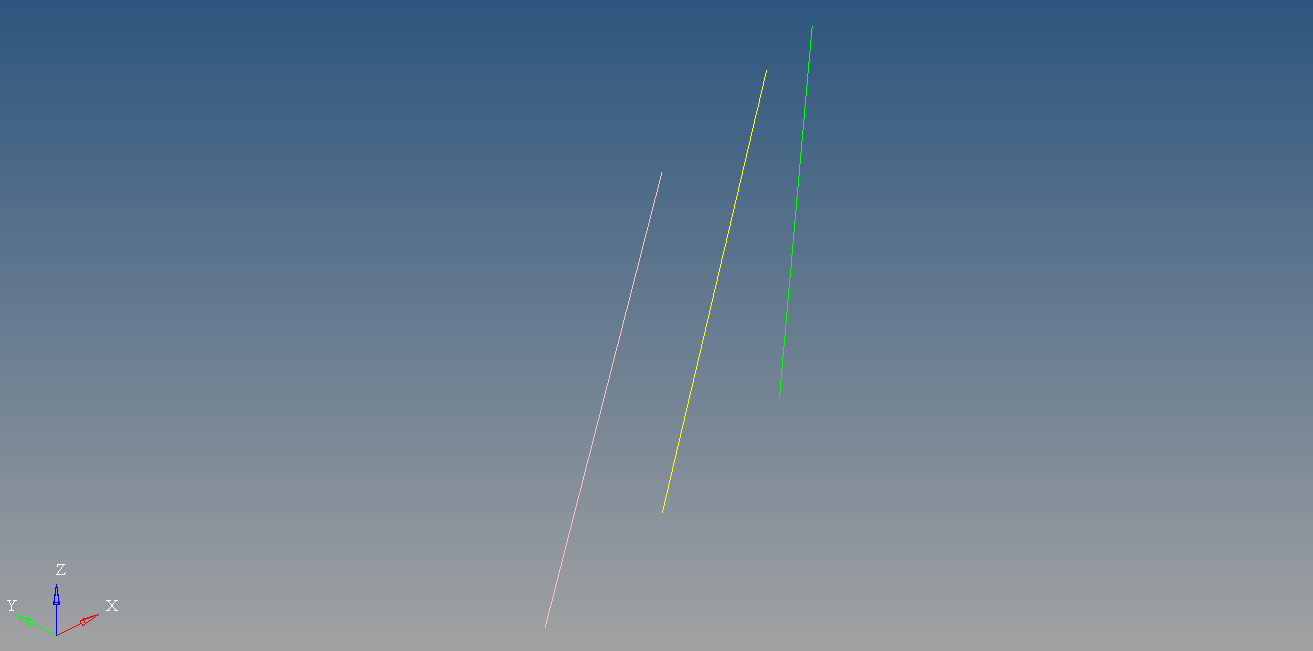 Figure 2.
 -
Select the FindElastoplasticEquilibrium subcase check box from the
Subcase table.
 Figure 3. Note: Once you select the subcase, all the other sections is activated.
 -
Select Increment 8 simulation
check box from the Simulation table.
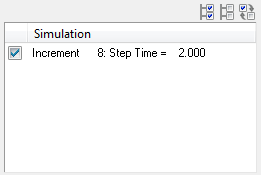 Figure 4.
 -
Select the required 1D components for plotting from the Components table.
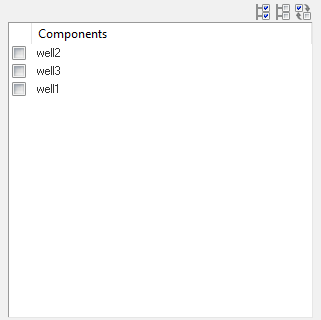 Figure 5.
 -
Select MD from the Well depth
along dropdown list under the General Options section.
 Figure 6.
 -
Display options section is used to define the well plot display
option.
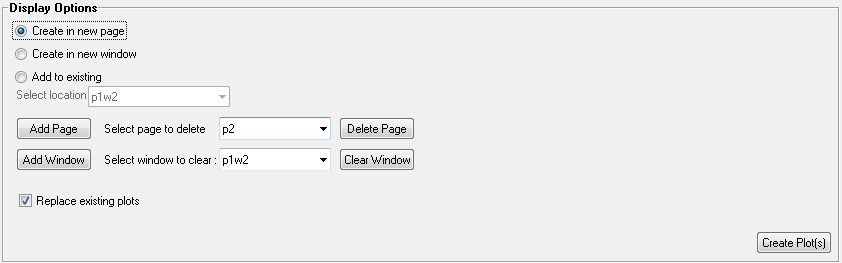 Figure 7.
 -
Click Include X,Y,Z
Fields check box under the Save As
Options section, to include field data.
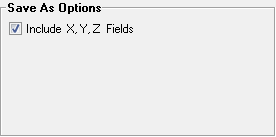 Figure 8.
 -
After defining all the well plot options, click
 .
A message window pops up.
.
A message window pops up. Figure 9.
 -
Click Ok to continue.
Confirmation window pops up.
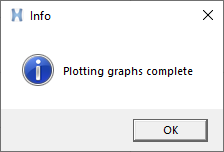 Figure 10.
 -
After defining the Well Plot options, click the file browser button
 in
the Export
Directory text field.
Browse for folder window opens.
in
the Export
Directory text field.
Browse for folder window opens. Figure 11.
 -
Click
 .
A message window opens.
.
A message window opens. Figure 12.