Urban Communication, 802.11a with Knife-Edge Diffraction
The network planning of a local area network in an urban scenario is investigated.
The knife edge diffraction method is used.
Sites and Antennas
There are six sites with one sector antenna at each site. Each antenna operates on
one of three different carrier frequencies around 2.4 GHz. The frequencies were
reduced from 5.2 GHz to 2.4 GHz in the 802.11a standard to increase the
communication range. The transmission site antennas are placed at different
locations and are directed toward the center to achieve a good data rate over the
entire region.
Air Interface
The wireless local area network (WLAN) air interface is defined by an 802.11a
wireless standard (.wst) file. OFDM/SOFDMA (orthogonal
frequency-division multiplexing) is selected for multiple access. It uses time
division duplex (TDD) for switching between uplink and downlink. In TDD, only
downlink carriers are defined since uplink and downlink are separated in time. In
this model, an adaptive switching method is used depending on the traffic load.
Tip: Click Project > Edit Project Parameter and click the Air Interface tab to view
the carriers and transmission modes.
Computational Method
The computational method Empirical Vertical Plane Model: Knife Edge
Diffraction is selected. The rays travel in the vertical plane
between transmitter and receiver and are diffracted at roof edges.
Tip: Click Project > Edit Project Parameter and click the Computation tab to change
the model.
Results
Propagation results show at every location the power received from each transmitting
antenna.
The network simulation also calculates the maximum received power and SNIR (max) for
all modulation and coding schemes used in this model, for both downlink and uplink.
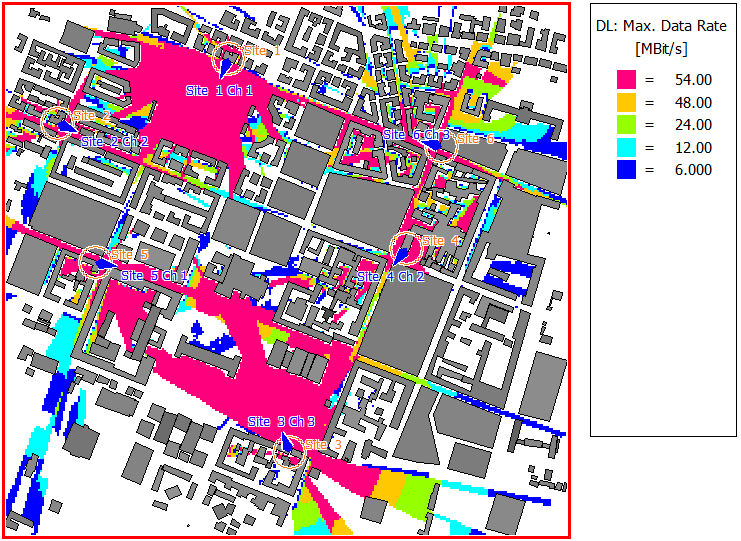
The figure below shows the maximum data rates. In white pixels, no communication is
possible. This can be due to insufficient received power, low SNIR, or both.
Remedies could include more antennas, higher mounting, more carriers, or higher
transmit power.