WiMAX, Urban, Mobile
Perform network planning for mobile WiMAX coverage in an urban scenario.
Model Type
The geometry is described by urban buildings in the city of Nuremberg, see Figure 1.
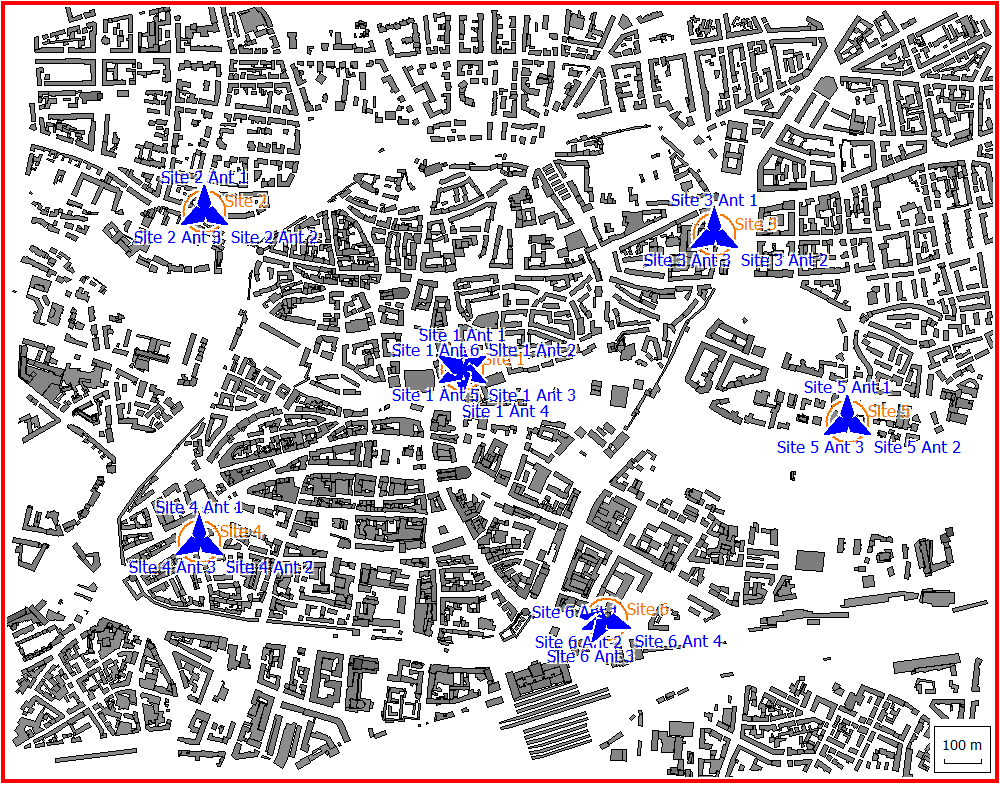
Figure 1. An urban database showing the geometry.
Sites and Antennas
There are six sites in this scenario at different locations. Site 1 has six directional antennas at a height of 40 m. Sites 2 to 5 have three directional antennas, each at a height of 32 m. Site 6 has four directional radiators at a height of 32 m. The antennas use twelve different carrier frequencies between 3.5 and 3.6 GHz. Since the number of carriers is smaller than the number of antennas, there will be some interference.
Air Interface
Computational Method
The empirical vertical plane model: knife-edge diffraction is selected as this method is appropriate when the dominant propagation to the receiver takes place over rooftops. In this example, the transmitters are high above the ground while the prediction height is 1.5 m where the mobile handheld receivers would be held. The bulk of the signal propagation would occur over rooftops and, to a lesser degree, through the streets.
Results
Propagation results show at every location the power received from each transmitting antenna. Results are calculated for a single prediction plane at 1.5 m height.
- cell area
- site area
- best server
- maximum data rate for both uplink and downlink
- minimum required transmitter power
- reception probability
- SNIR (max) for all modulation and coding schemes for uplink and downlink
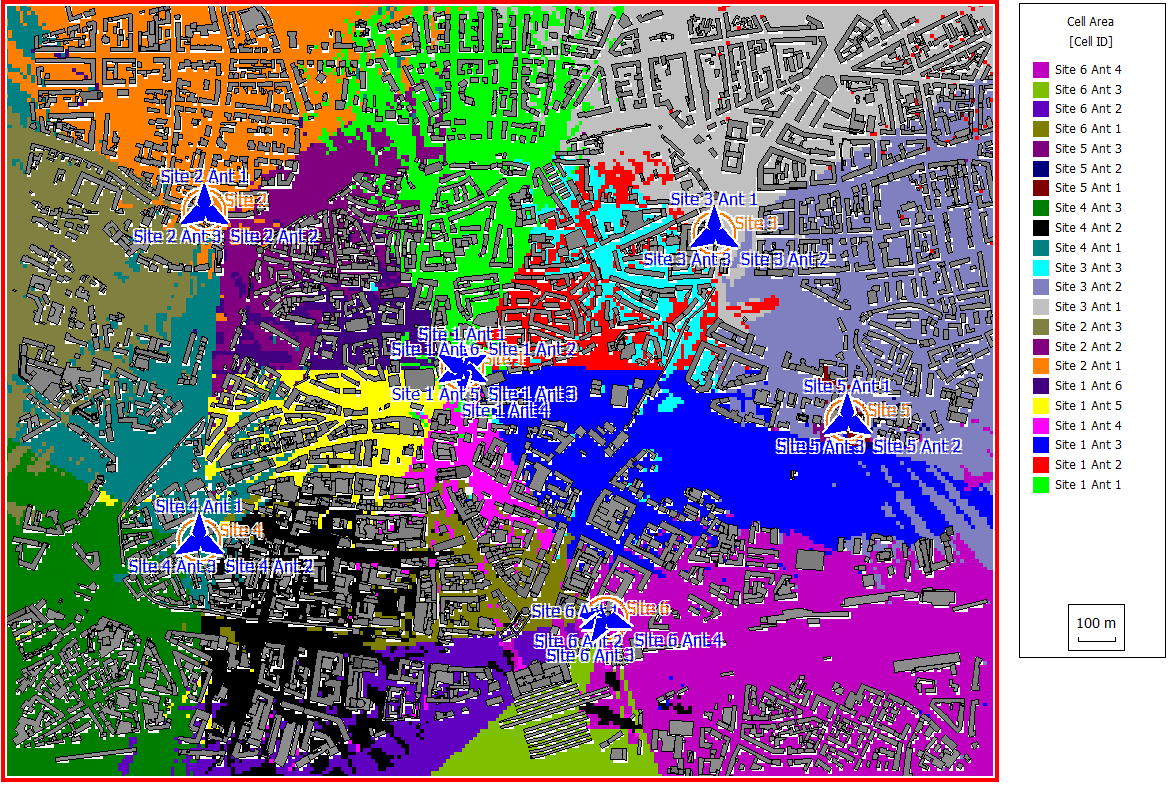
Figure 2. The cell areas for all the antennas.
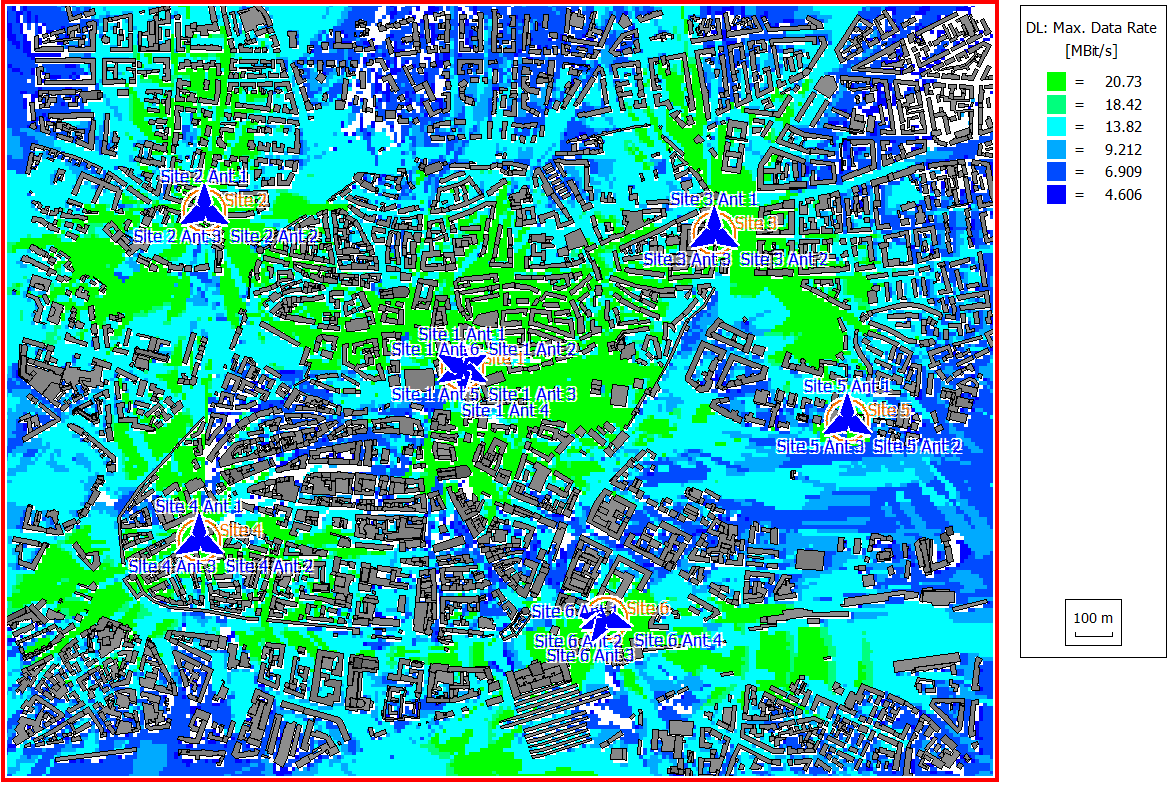
Figure 3. The maximum data rate for the downlink.