TETRA Coverage, Urban
Perform TETRA network planning in an urban scenario.
Model Type
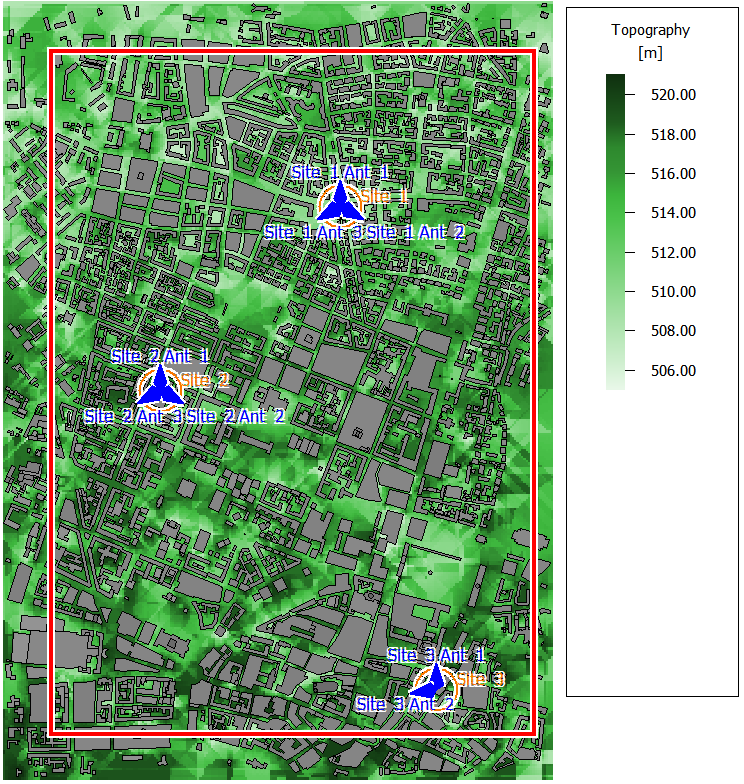
Figure 1. Urban database: topography and buildings.
Sites and Antennas
- Site 1 with three directional antennas at a height of 25 m
- Site 2 with three directional antennas at a height of 22 m
- Site 3 with two directional antennas at a height of 25 m
Air Interface
The air interface is defined by a TETRA wireless standard (.wst) file. TETRA uses time division multiple access (TDMA) with four time slots per radio carrier and 25 kHz spacing between carriers. Frequency division duplex (FDD) separation between uplink and downlink is set to 10 MHz.
Computational Method
The dominant path model (DPM) computation method is selected. This method focuses on the most relevant path, which leads to a shorter computation time compared to full ray tracing, while still providing high accuracy.
Results
Propagation results show at every location the power received from each transmitting antenna. Results are calculated for a single prediction plane at 1.5 m height. Simulation is performed for each individual transmitter. Therefore the prediction (simulation) area is the superposition of the prediction areas defined individually for each transmitter.
For all modulation and coding schemes used in this model, the network simulation calculates minimum transmitted power, maximum received power, SNIR (max), and reception probability for both uplink and downlink.
Figure 2 shows the data rates for network planning. By TETRA standards, high data rates can be expected almost everywhere. The fact that each base station antenna has its carrier frequency minimizes interference.
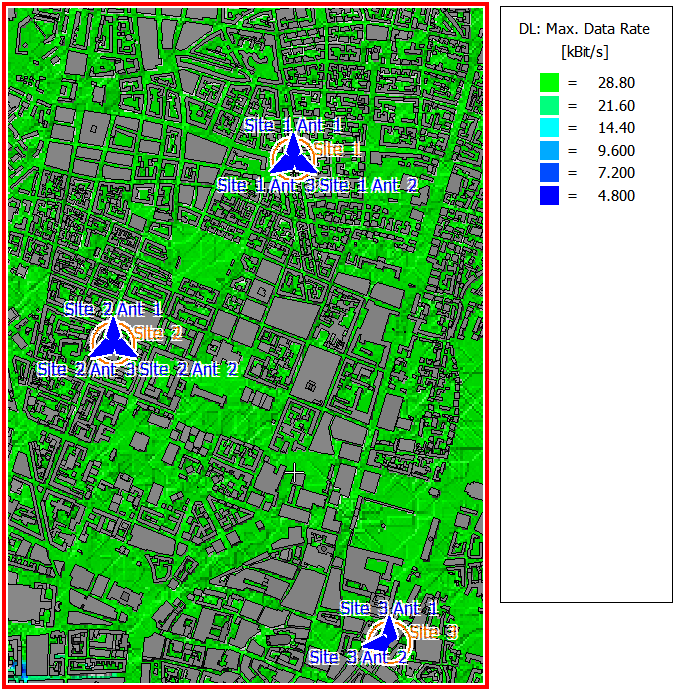
Figure 2. Maximum data rates for the network planning.