Rural / Suburban Communication, 2.5G
The network planning of a rural/suburban scenario with 2.5G is investigated.
Geometry
The geometry is described by topography (elevation) and clutter. The clutter map describes areas that are, for example, urban, open, or water. The Database tree in the Tree view enables you to view the two displays, click either Topography or Clutter/Morpho.
Sites and Antennas
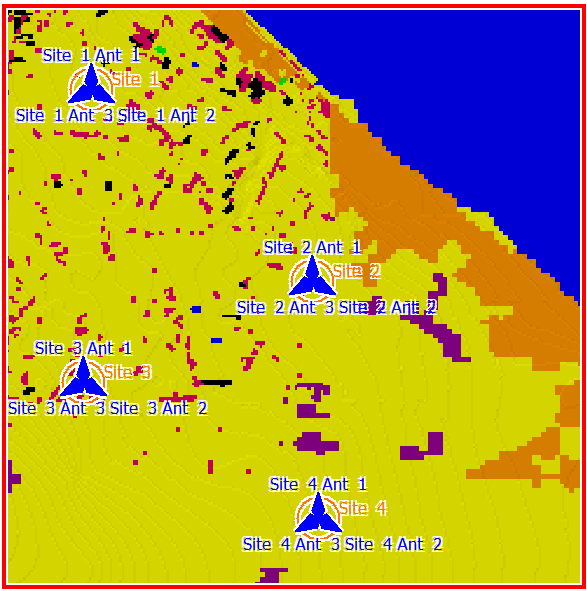
Figure 1. Rural suburban area topography and transmitter sites.
Air Interface
Computational Method
In this case, the method that is used is the empirical two-ray model (ETR) (with breakpoint: dual slope model) as it takes multipath propagation into account. When used by itself, it might leave pixels in shadow areas blank. To estimate the signal in shadow areas, select Consideration of Knife-Edge Diffraction in Vertical Plane.
Results
Propagation results in this project include power coverage for each transmitting antenna of all four sites. This is the power that an isotropic receiver at a given position would receive from the transmitter.
- best server
- maximum data rate
- signal to noise and interference ratio (SNIR)
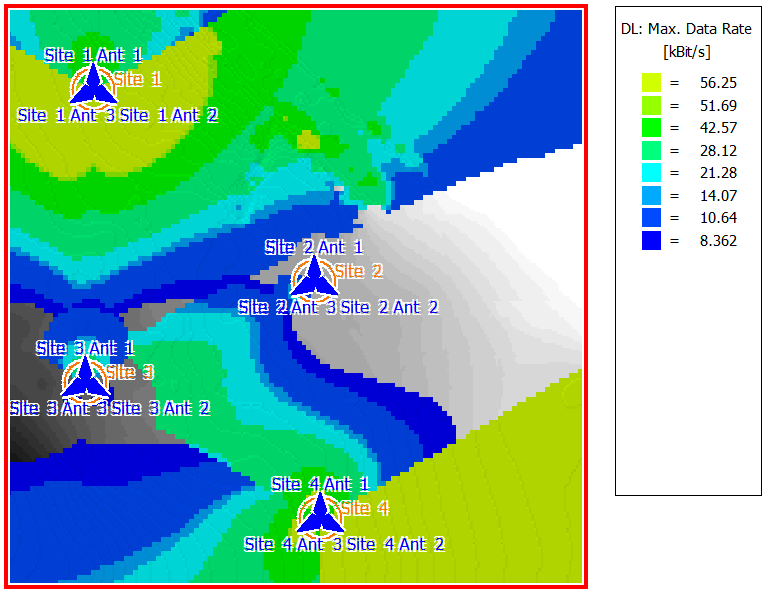
Figure 2. Maximum data rates for the rural, suburban network results.