Indoor LTE Using MIMO
Perform network planning for long term evolution (LTE) using multiple input multiple output (MIMO) in an indoor scenario.
Model Type
This is an example of an indoor scenario that uses multiple input multiple output technology. The project is a network planning project based on a .wst file for the air interface.
Sites and Antennas
Air Interface
Overhead and interference associated with having two MIMO streams on the same carrier are specified on the Air Interface tab. In addition, all available carriers and transmission modes are listed on the Air Interface tab.
Computational Method
Empirical losses are calculated along the propagation path for which material properties are required. Material properties are easier to obtain compared to physical parameters. In addition, the parameters of the empirical model can readily be calibrated with measurements. Therefore it is easier to achieve high accuracy with the empirical model.
Results
Propagation results show, at every location, the power received from the transmitting antenna.
- signal area
- cell area
- site area
- best server
- maximum data rate
- maximum throughput
- MIMO streams for uplink and downlink
- minimum required transmitter power
- maximum receiver power
- SNIR
- reception probability
- maximum number of parallel streams at a pixel
- throughput at a pixel in transmission mode for uplink and downlink
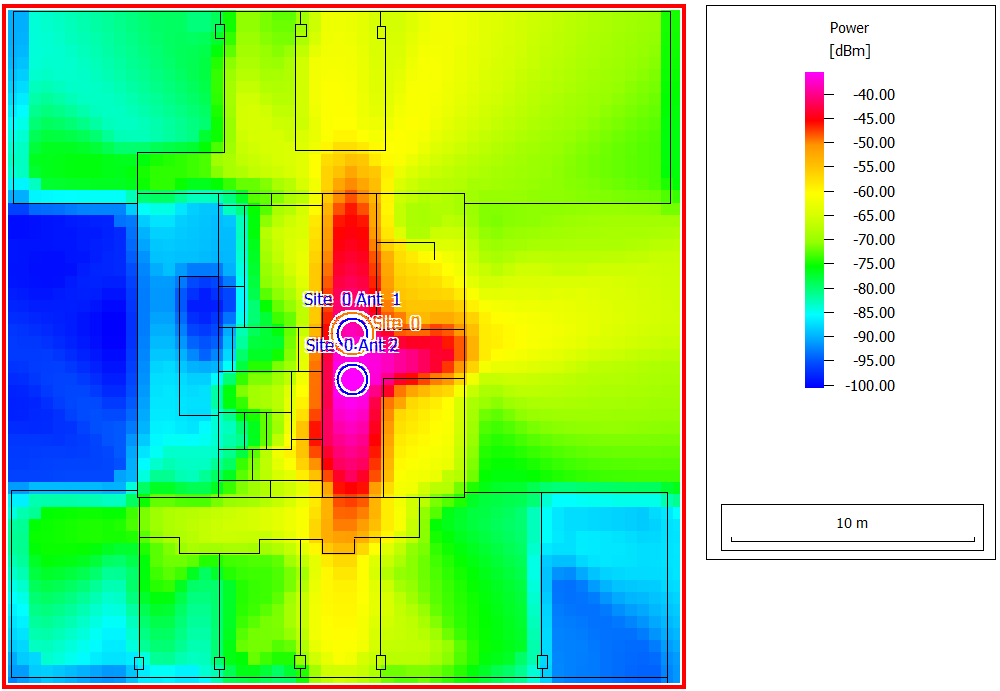
Figure 1. Propagation results: power of Site 0, Antenna 2.
The power level in the area on the left (Figure 1) is very low. This low power level results in white pixels in the network analysis results since the power level is too low in that specific location for communication with the modulation and coding schemes of this air interface.
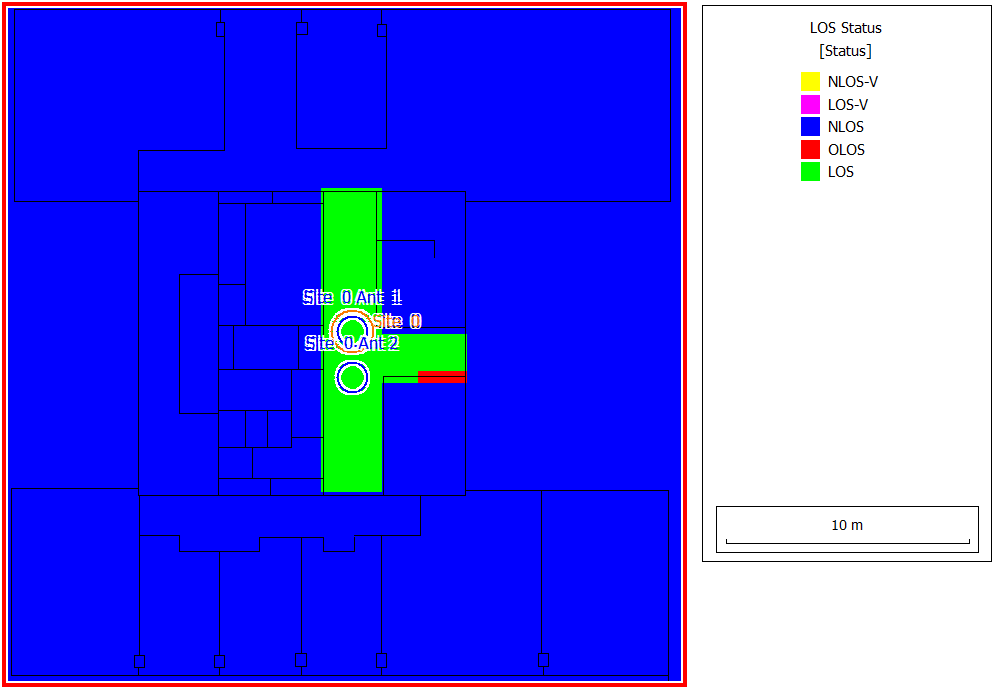
Figure 2. LOS (line-of-sight) results: Site 0, Antenna 2.
- Line-of-sight (LOS) condition: a direct line of sight between transmitter and receiver, represented by the green color in Figure 2.
- Obstructed-line-of-sight (OLOS) condition: the transmitter and receiver do not have walls between them (the transmitter and the receiver are in the same corridor but without having a direct line of sight - only for indoor scenarios), represented by the red color in Figure 2.
- No-line-of-sight (NLOS) condition: the rays from transmitter to receiver have to pass through a wall. This is represented by the blue color in Figure 2.
In most locations the signal strength is high while interference is low, leading to reception of both MIMO streams, see Figure 3. This enables communication at almost twice the rate of a single stream. The maximum data rate is shown in Figure 4.
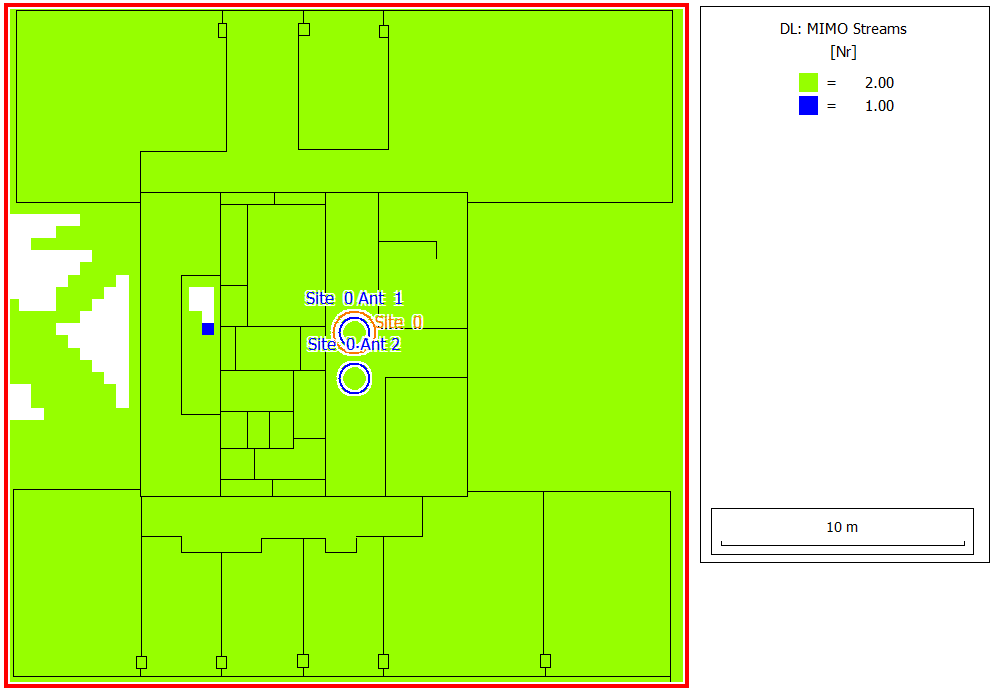
Figure 3. The number of MIMO streams received in the downlink.
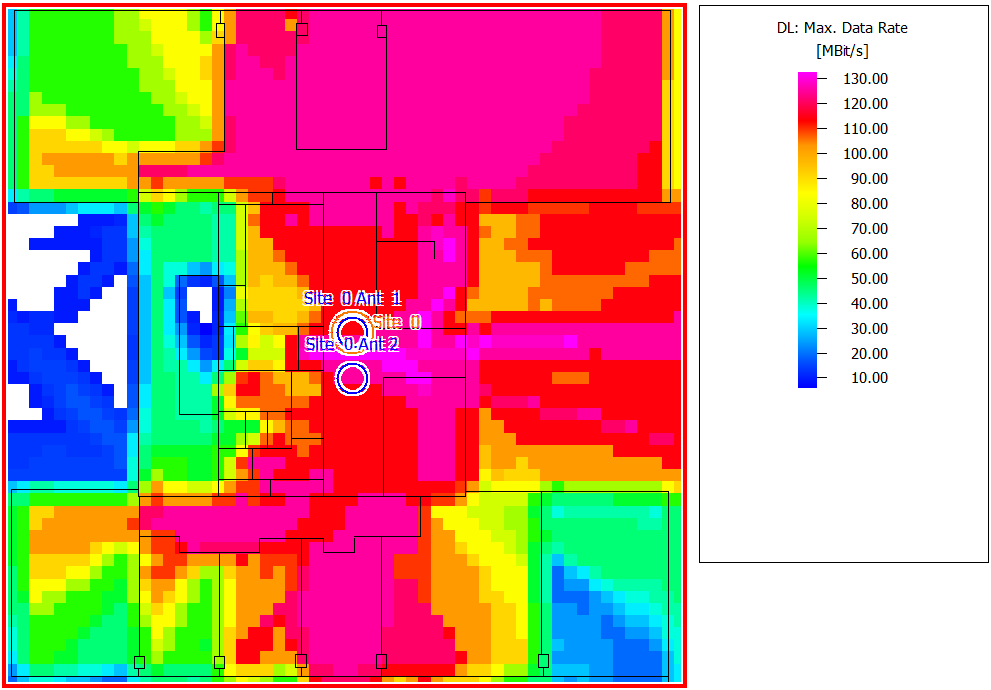
Figure 4. The maximum data rate in the downlink.