Interactive Section
Based on the selected impactor type, a table is inserted in the Interactive Section tab.
Hyperlinks in the table allow you to click on a table cell to display the data in the GUI. The table content changes per the selected impactor type: Head, Upper Leg, or Lower Leg.
- Head Impactor
- A table is inserted in the GUI with the target location, displacement value, time, and HIC values.
-
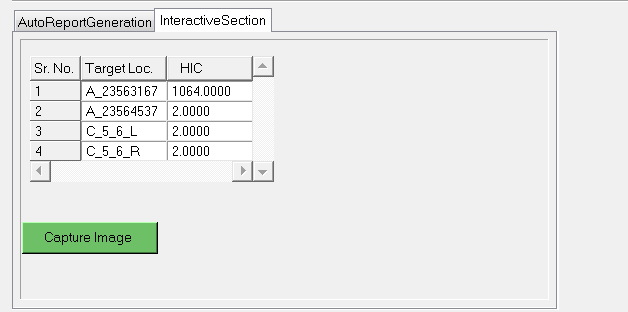
Figure 1.- From the Target Loc. column, click on the deck name (row) to display the acceleration vs time plot, the section cut at the target point in animation, and an image of the hood with all points displaced and with the selected row shown in a text box for HIC.
- From the HIC column, click in a cell to plot and expand the Acceleration Vs Time graph.
- Right-click anywhere on the table to expand the active contour.
- Click Capture Image to capture an image of the data displayed on the current page in your session.
- Upper Leg Impactor
- For the upper leg impactor type, the tool generates the Resultant Force vs Time and Bending Moment vs Time graphs.
-
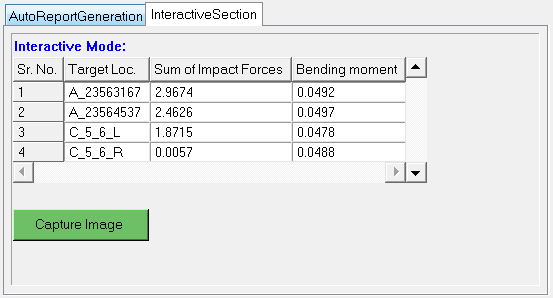
Figure 2.- From the Target Loc. column, click on a deck name to display the impactor position, Resultant Force vs Time, and Bending Moment Vs Time graphs in the current HyperView session.
- From the Sum of Impact Forces column, click the force value to expand the Resultant Force Vs Time graph.
- From the Bending Moment column, click the bending moment value to expand the Bending Moment Vs Time graph.
- Capture Image captures an image of the current page.
- Lower Leg Impactor
- For the Lower Leg impactor type, the tool generates Knee Bending Angle vs Time, Knee Shear Displacement vs Time, and Upper tibia acceleration vs Time graphs.
-
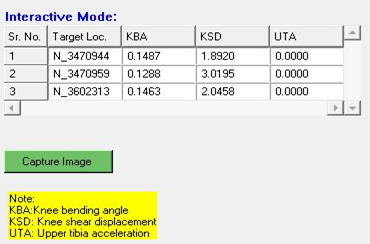
Figure 3.- From the Target Loc. column, click on a deck name to display the impactor position, Knee Bending Angle Vs Time, Knee Shear Displacement Vs Time and Upper tibia acceleration Vs Time in the current HyperView session.
- From the KBA column, click in a cell to expand the Knee Bending Angle Vs Time graph.
- From the KSD column, click in a cell to expand the Knee Shear Displacement Vs Time graph.
- From the UTA column, click in a cell to expand the Upper tibia acceleration Vs Time graph.
- Capture Image captures an image of the current page.