Context Menu
From the HyperGraph modeling window, right-click to display HyperGraph context menus.
Plot Window
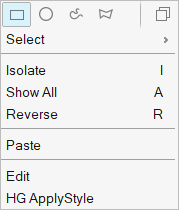
Figure 1. Plot Window Context Menu
- Select
- Select > Displayed selects the displayed curve(s).
- Isolate
- Isolate displays only the selected curve(s), turning their display state to on, and turning all other curves off.
- Show All
- Displays all previously hidden curves.
- Reverse
- Hides the selected curve and displays only the non-selected curves.
- Paste
- Edit
- Use the Entity Editor to edit the plot's attributes.
-
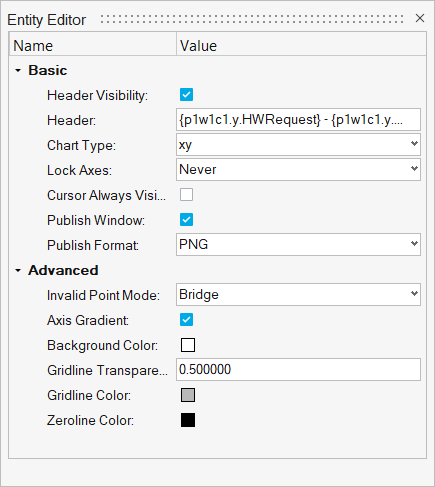
Figure 2. Plot Options Entity Editor - HG Apply Style
- Displays the Apply Style dialog. From this dialog, select and apply attributes of the current plot to either every plot on every page or to every plot on the current page.
- Switch to Real/Imaginary and Switch to Phase/Magnitude
- If the plot type is set to Complex Plot, use this option to toggle between the real/imaginary and phase/magnitude axes.
- Swap Complex Axes Position
- If the plot type is set to Complex Plot, use this option to switch the position of the complex axes from top to bottom.
Curve Context Menu
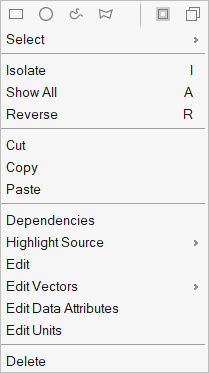
Figure 3. Curve Context Menu
- Dependencies
- Right-click on a curve and select Dependencies to display the View Dependencies dialog. Use this dialog to review the source for the x and y vectors of the current curve, as well as the source for any other vector involved in their definition. You can modify the base file used for the curve, as well as the Type, Request, or Component.
- Highlight Source
- If a HyperView window is open and on the same page as the HyperGraph window, and you select this option, the node or element is selected on the HyperView animation file.
- Edit
- Displays the Entity Editor for curves. Use this dialog to edit the curve's properties.
- Edit Vectors
- Displays the Entity Editor for the selected vector. Use this dialog to edit the vector's properties.
-
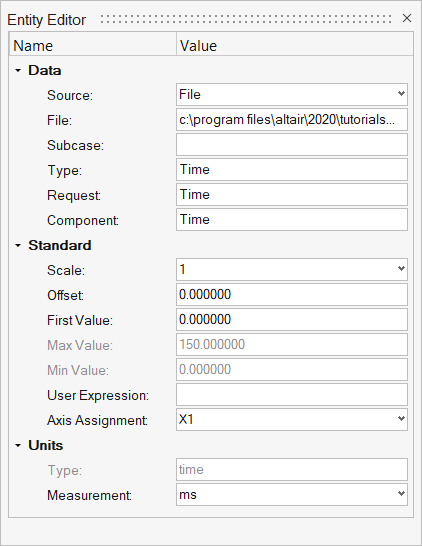
Figure 4. Entity Editor, Vectors - Edit Data Attributes
- Displays the Data Attributes Table to access the curve’s metadata.
-
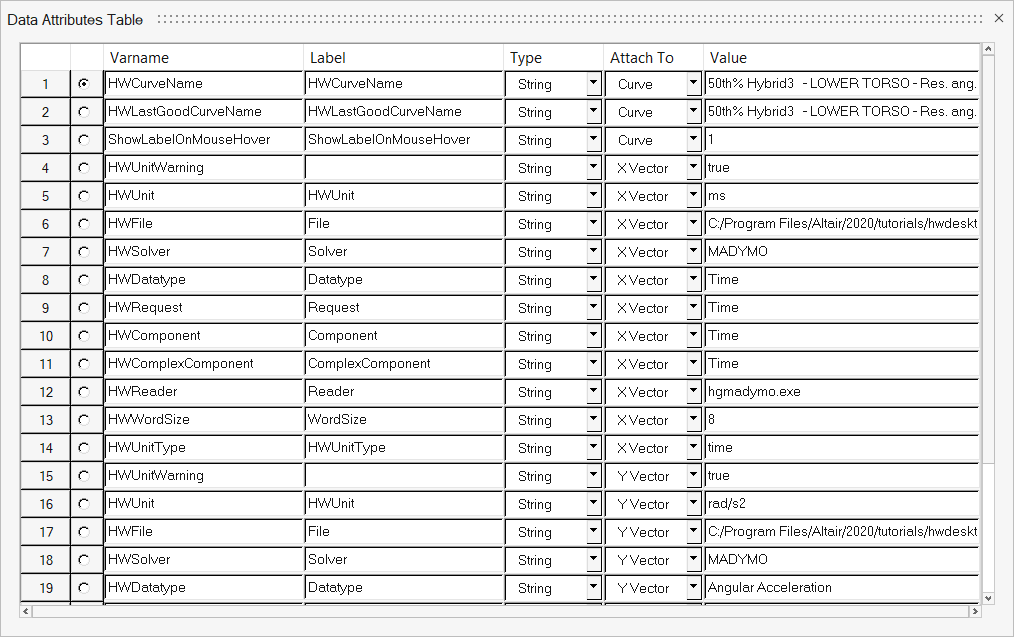
Figure 5. Data Attributes Table - Edit Units
- Displays the Enable/Change Curve Unit dialog, which you can use to select a new unit type for the x and y vectors. See Enable Units for more information.
- Filter, Math, and Injury
- If the Vehicle Safety Tools preference files is loaded, or a curve contains vehicle safety information, the Filter, Math, and Injury menu items are displayed.