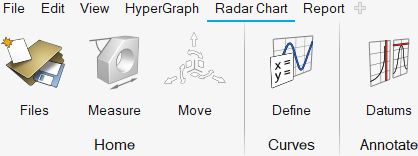
From the HyperGraph menu, select Radar
Chart to display the Radar Chart ribbon.
You can use HyperGraph to plot vector, phase vs.
magnitude, and radar plots. Use radar plots to plot complex data. The phase axis for
a radar plot is equivalent to the phase axis for a complex plot. The mag-axis for a
polar plot is equivalent to the magnitude axis for a complex plot. The key
differences are plotted polar coordinates - only a single frequency is
displayed. Figure 1. Radar Chart Ribbon