Transforms
Provides several functions to calculate running statistics, regressions, FFTs, etc.
- Histograms (abs)
- Histograms (rel)
- Creates a simplified histogram (plot) representation of selected data, showing the relative frequency that a given value appears in the vector, or its absolute value.
- Fourier Transforms
-
- Rectangular
- Rectangular window applied to data in the frequency domain.
- Hanning
- Hanning windowing function.
- Welch
- Welch windowing function.
- Hamming
- Hamming windowing function.
- Blackman
- Blackman windowing function.
- Parzen
- Parzen windowing function.
- Inverse
- Matrix inversion function.
- Running Stats
-
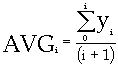
- Average
- The statistical measures are made at the current point, using all prior data points.
- Median
- Minimum
- Maximum
- Std. Dev.
- Regression
- For linear through 10th degree: Polynomial least squares curve fit function.
-
- Linear
- Quadratic
- Cubic
- 4th-10th degree
- Powery = A*xB
- Fit given data to
 , where A and B are calculated
for best fit.
, where A and B are calculated
for best fit. - Exponentialy = A*exp(B*x)
- Exponential least-squares curve fit function.
- Logarithmicx = A+B*In(x)
- Fit given data to
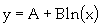 , where A and B are calculated
for best fit.
, where A and B are calculated
for best fit. - Inversey = I/(A+B*x)
- Fit given data to
 , where A and B are calculated
for best fit.
, where A and B are calculated
for best fit.
- Derivative
- Curve derivative function.
- Integral
- The integral function.
- Cross Correlation
- Cross correlation between two curves.
- Auto Correlation
- Splines
- Cubic spline interpolation function.
- Sample Points
- Resample or sample points. Resamples the given input curve to the specified data frequency.
- Digital Filter
- Impulse response filter function.