Network View
The network view is a block diagram view emphasizing inter-connectivity of the assembly.
It is one of the three views in the assembly environment, along with the graphics view and the browser view. The network view is the best way to show coincident connections and provides an easy way for checking the number of connections between any two modules, reducing modeling errors.
To invoke the network view, click the ![]() icon.
icon.
Entities in the Network View
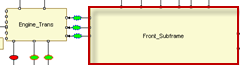
Figure 1.
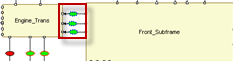
Figure 2.
Organizing the Network View of an Existing Assembly
When invoking the network view for the first time, an auto generated block diagram is displayed, which is not likely satisfying. After some effort in organizing the modules and connections, the block diagram can be organized in an easy to view form. The organized view can then be saved in the assembly .xml file so that the organized view will be available when the .xml file is imported.
- Turn off the visibility connections by unchecking the Visibility checkbox.
- Click the icon
 to increase the horizontal box size so that
the module names are mostly inside of the boxes. Make sure that the entity resize toggle
is turned on.
to increase the horizontal box size so that
the module names are mostly inside of the boxes. Make sure that the entity resize toggle
is turned on.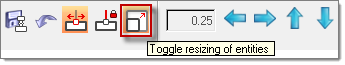
Figure 3. - Make the body box wider. Block the select half of the modules by dragging the left mouse cursor and then move the selected modules up to make room. Click the body's left and right edge and then drag to enlarge the horizontal size.
- Arrange the modules connected to the body above and below the box first and then sequentially arrange the remaining modules based on their connectivity.
- Re-check the Visibility checkbox to turn on the connectors.
- Click the
 icon to reset the
connection locations to Auto Generated Positions.
icon to reset the
connection locations to Auto Generated Positions. - Rearrange and expand the collapsed connections until the view is satisfactory.
Entity Sizing Control
Module and connections can be selected to be moved by left-clicking the object. To move a tagpoint, left-click the small circle while holding down Ctrl.
When moving modules, attached connections can be set to either move with the modules by
clicking the ![]() icon to on, or stay at their
current positions by clicking the icon to off. When moving either modules or connections,
connection lines can be set to maintain a perpendicular relationship to module boxes by
clicking the
icon to on, or stay at their
current positions by clicking the icon to off. When moving either modules or connections,
connection lines can be set to maintain a perpendicular relationship to module boxes by
clicking the ![]() icon to on.
icon to on.
Interrogating Module and Connection Definitions
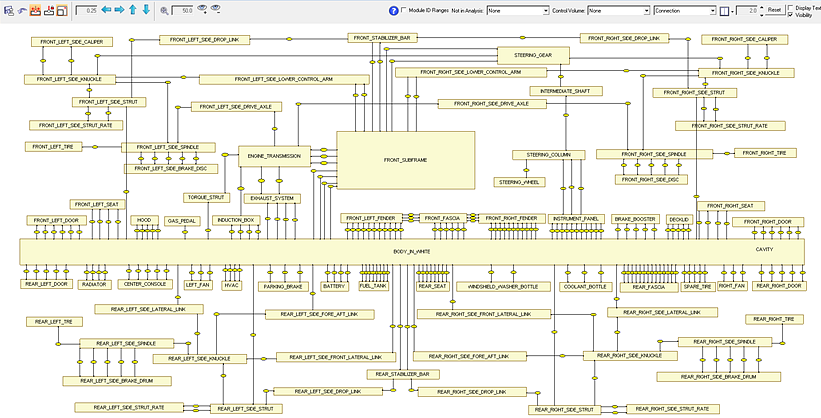
Figure 4.

Figure 5.
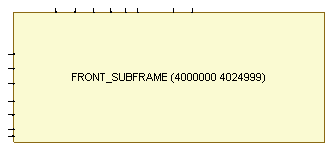
Figure 6.
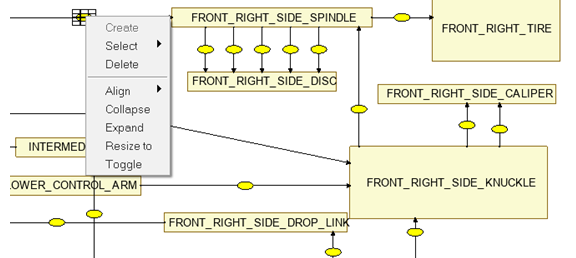
Figure 7.
Create/Delete Modules and Connections
Modules can be created or deleted by using the context menu.
At this point, connection creation/deletion can only be done from the connection creation GUI and the Connector browser. The alignment of both module and connection can be accomplished from the same context menu.
Pan/Zoom/Fit All

Figure 8.
- Dynamic zoom
- Can be done by clicking Ctrl and scrolling the middle mouse button.
- Window zoom
- Can be done by clicking Ctrl and drawing a window while holding the middle mouse button.
- Fixed zoom
- Can be done using the icons shown below.
Figure 9.
Fit All can be done by clicking the ![]() icon.
icon.
Coloring Capabilities
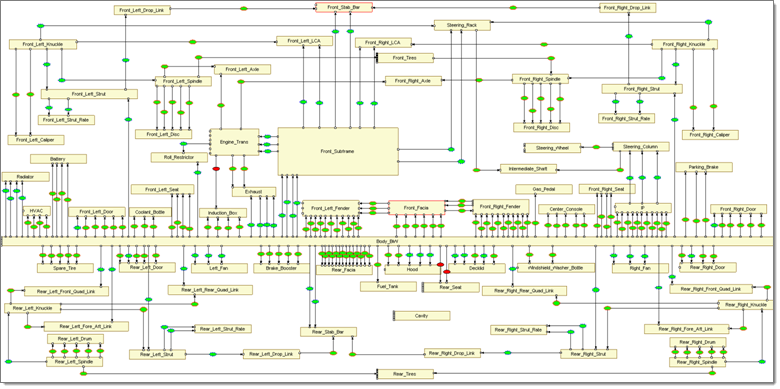
Figure 10.
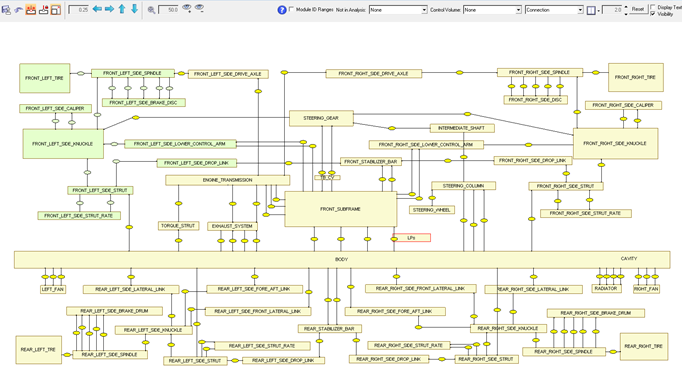
Figure 11.
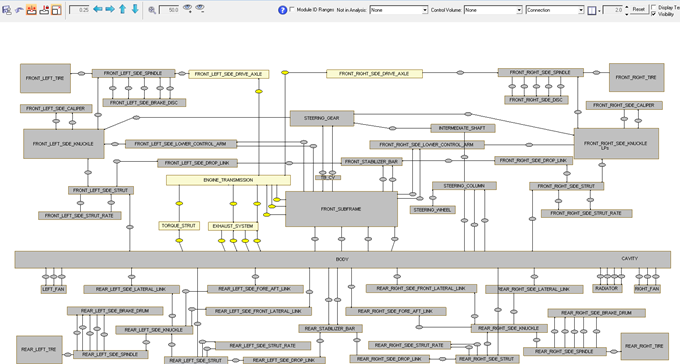
Figure 12.
Figure 13. A Module with a Solid Red Outline Represents a Module not Assigned with a Representation File
Figure 14. A Module with a Solid Black Outline Represents a Module Assigned with a Representation File
Figure 15. A Module with a Solid Black Outline and Gray Inside Represents a Module outside the Subsystem Selected for Analysis
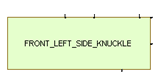
Figure 16. A Module with a Solid Black Outline and Green inside Represents a Module Part of the Rolled-up Parent Module and Set for Analysis
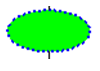
Figure 17. A Connection with a Dotted Blue Outline and Dark Green inside Represents a Realized Connection with PBUSH Type
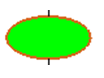
Figure 18. A Connection with a Solid Red Outline and Dark Green inside Represents a Realized Connection with Rigid Type
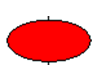
Figure 19. A Connection with a Solid Black Outline and Red inside Represents a Failed Connection for Realization
Figure 20. A Connection with a Solid Black outline and Gray inside Represents a Connection outside the Subsystem Selected for Analysis and not Selected for Realization
Figure 21. A Connection with a Solid Black outline and Light Green inside Represents a Connection Between the Child Modules of the Rolled-up Parent Module and set for Analysis
- Control Volume
- Highlights the modules belonging to a particular control volume and connections inside and on boundary of control volume.
-
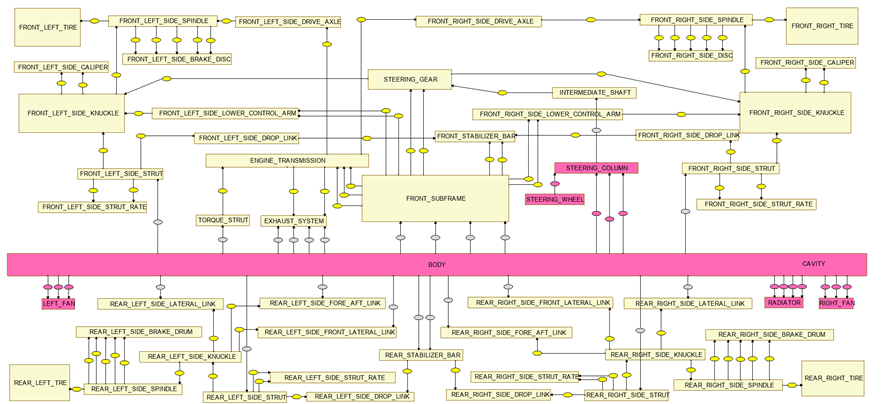
Figure 22. - Not in Analysis
- Highlights the modules that are not defined for a particular analysis.
-
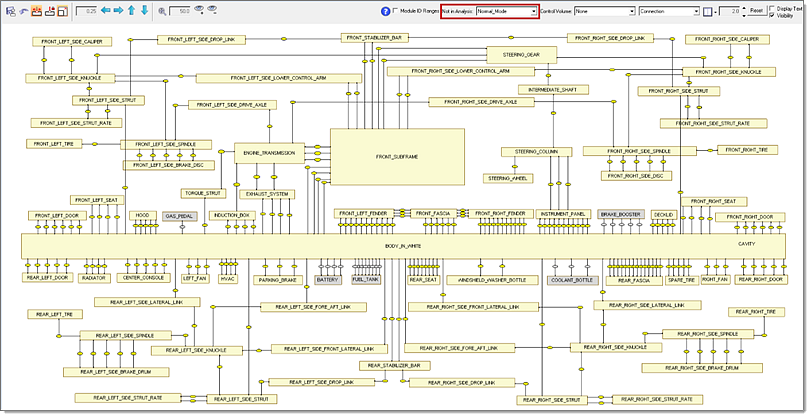
Figure 23.
Template CSV Support for Import/Export
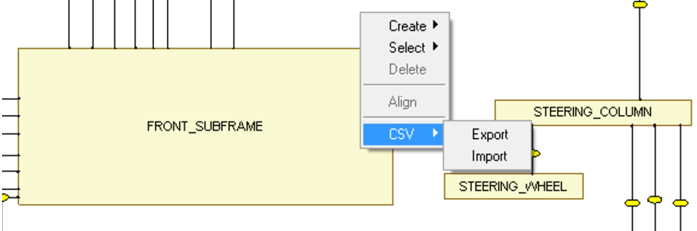
Figure 24.
Connection Realize/Unrealize
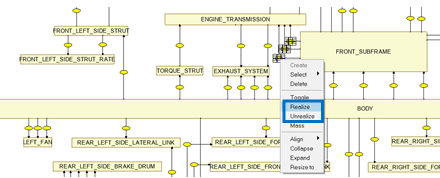
Figure 25.
Mass of Modules and Connections
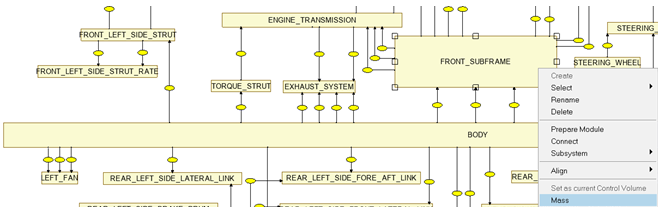
Figure 26.
Prepare Modules
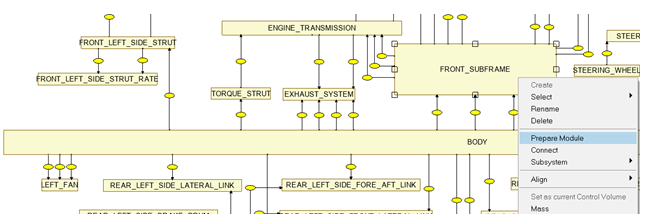
Figure 27.