Well Plot
The Well Plot tool enables the user to plot any results present along 1D elements (that is, a well) in the result deck.
 Figure 1.
 Note:
- It is recommended to use h3d file with 1D elements and the corresponding 1D mapped results as model and results file as input to the Well Plot tool.
- The mapped results must have suffix Map in the results label. If the h3d file contain no 1D components (or elements) and 1D mapped results, then the user cannot run the tool.
- The loading of the model and result files can be done either before or after the launching of the tool.
-
Select the Well Plot tool from the Select GeoD Tool drop down list.
 Figure 2.
 -
Click the Load Model from the Task table.
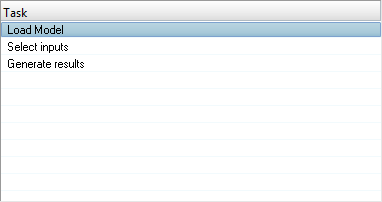 Figure 3.
 -
Click Select inputs task.
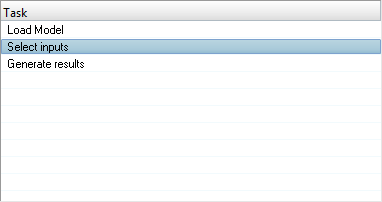 Figure 4. The Select inputs panel is displayed.
 Figure 5.
 -
Click the Select All
 button.
All available subcases are selected.
button.
All available subcases are selected. -
Click the Select None
 button.
All subcases are deselected.
button.
All subcases are deselected. -
Click the Select Reverse
 button.
Subcase selection is reversed.
button.
Subcase selection is reversed. -
Select the required simulation from the Simulation table.
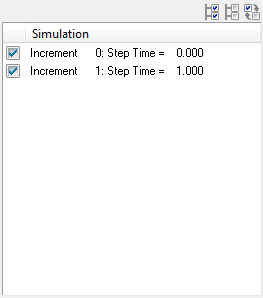 Figure 6.
 -
Select the required well direction from the Well depth
along drop down list under the General Options section.
 Figure 7.
 -
Display options section is used to define the well plot display
option.
 Figure 8.
 -
Click Add to existing radio button, to view the results in an existing
page or window.
Select Location drop down list is activated.
 Figure 9.
 -
Click Include X,Y,Z
Fields check box under the Save As
Options section, to include field data.
 Figure 10.
 -
Click
 .
A message window is displayed.
.
A message window is displayed. Figure 11.
 -
Click OK to continue.
Confirmation window is displayed.
 Figure 12.
 -
Click the file browser button
 in the Export
Directory text field, after defining the Well Plot options.
Browse for folder window is displayed.
in the Export
Directory text field, after defining the Well Plot options.
Browse for folder window is displayed. Figure 13.
 -
Click
 .
A message window is displayed.
.
A message window is displayed. Figure 14.