This exercise uses the cwing.xml file located in the
animation folder as both the model and results file.
In this tutorial you will:
Create and contour a new scalar result
Create and contour a new tensor result type
Create a new result type which is locked to a particular Load Case
To access the Derived Results Expression Builder:
Click the Derived Results button on the Result toolbar.
OR
Select Create > Derived Results from the menu bar.
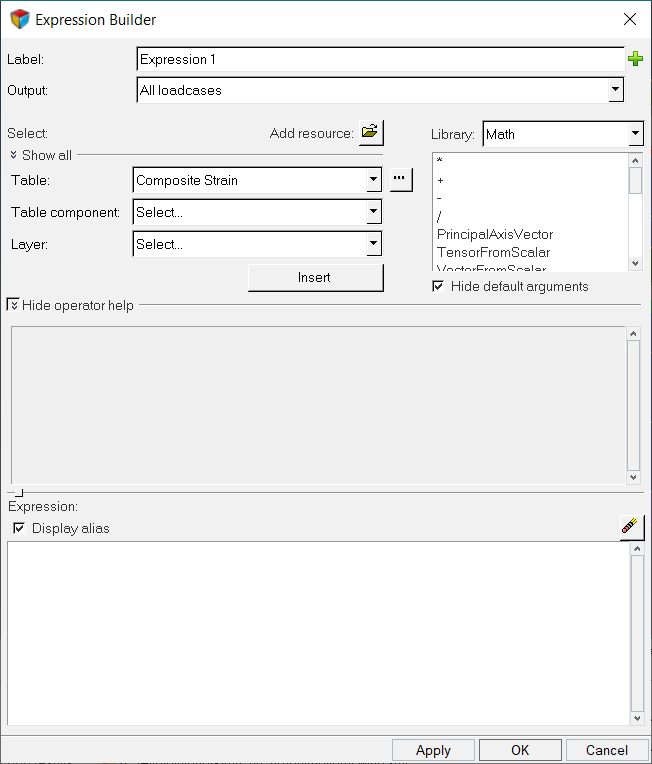
Figure 1.
The Derived Results Expression Builder allows you to perform math operations on the
scalar and tensor results types that are available in the result file. See the Expression Builder topic for additional
information.
Create a Scalar Derived Result
Load the cwing.xml file, located in the
animation folder.
In the Results Browser, expand the folders for
Results, Tensors, and then
Stress.
Figure 2.
Right click on P1 (major) and select Create > Derived Result.
Figure 3.
Note: In the Table and Table component fields, Stress and P1
(major) are already selected. This is because Derived Result was
selected from a result in the Results Browser. If a
result was not selected, or if the Derived Result Expression Builder was
launched from the icon on the toolbar , the first result listed
in the result file would be loaded.
Enter Stress Amplitude for the
Label.
In the Table field, leave Stress
as the selection. Also, for the Table component, leave
P1 (major) selected. Click
Insert to add the P1 (major) stress to the
expression.
Figure 4.
In the Expression field, T3.C7 is entered. This is the
short hand notation that HyperView uses for this result.
In the Expression field, after
T3.C7, enter a minus sign
(-).
For Table component, select P3
(minor) and then click Insert.
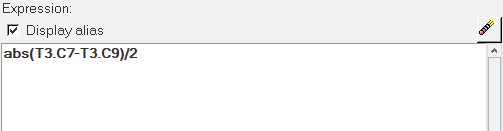
Update the Expression by adding abs(
before T3.C7.
Finish updating the Expression by adding
)/2 after T3.C9 so that the
complete expression reads as shown below:
Figure 5.
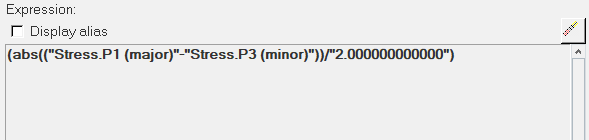
Uncheck the option for Display alias.
This displays the Expression with the full component
names. While it is easy to read in this example, viewing the full component
names in the Expression can be hard to read when more
complicated equations are used.
Figure 6.
Check the option for Display alias and then click
Apply.
Note: Do not close the dialog as we will use the icon to create another derived result.
Create a Tensor Derived Result
In the Expression Builder, click the icon located to the right of the Label field.
Enter Double Stress for the Label.
For Table, select Stress.
Click Insert to add Stress to the Expression.
In the Expression field, type *2.0 so that the
expression is as shown below:
Figure 7.
Click OK.
Plot the Two Derived Results
Within the Results Browser, expand the folders for
Results and Scalars.
Next to Stress Amplitude, click the contour icon to
apply a contour to the model in the graphics window with the new result:
Figure 8.
Next, within the Results Browser, under Results, expand the folder for
Tensors.
Note: There is now a new Tensor called Double Stress.
Expand the folder for Double Stress.
Figure 9.
HyperView determines if the new result type is a
tensor or scalar and then lists the new result in the appropriate folder in
the Results Browser.
Click the contour icon next to any of the components (for example, vonMises to
apply a contour in the graphics window with the new result.
Figure 10.
Created a Derived Results for a Specific Load Case
In the Results Browser, expand the Scalar folder and select the icon next to
Stress Amplitude to create a contour plot.
Also in the Results Browser, change the subcase by clicking on
SUBCASE 1 = Load Case 1: Max Torque, and
SUBCASE 2 = Load Case 2: Min Torque.
Note: The contour changes to reflect the updated subcase.
Next we will create a Derived Result that references a specific subcase.
Right-click in the white area of the Results Browser and select Create > Derived Result.
In the Expression Builder, enter Stress Difference for
the Label.
Under Select, click the downwards pointing arrows next to Show All.
Figure 11.
This shows all the options available for the selected results. This includes
specifying a specific Loadcase and Frame.
For Table, select Stress.
For Table component, select vonMises.
For Layer and Resource leave the default values.
For Loadcase and Frame, leave the value set to Current.
Click Insert to add the result to the Expression.
Add a minus sign - to the Expression after T3.C11.
Next, a specific Loadcase will be specified for the vonMises stress value.
Update the Loadcase field to SUBCASE 1 = Load Case 1: Max
Torque and then click Insert.
In the Expression field, add 100*( to the beginning of
the expression.
At the end of the expression, add )/T3.C11.
Verify that the expression in the Expression field is as shown
below:
Figure 12.
Click OK.
Using the Results Browser, expand the Scalar folder and select the icon next to
Stress Difference to contour the model.
Figure 13.
Update the subcase to SUBCASE 1 = Load Case1: Max
Torque.
Figure 14.
Note: All the values are zero. This is because the expression in
the Stress Difference result subtracts the vonMises Stress from Subcase 1
from the Current Subcase, which in this case is also Subcase 1.
 on the Result toolbar.
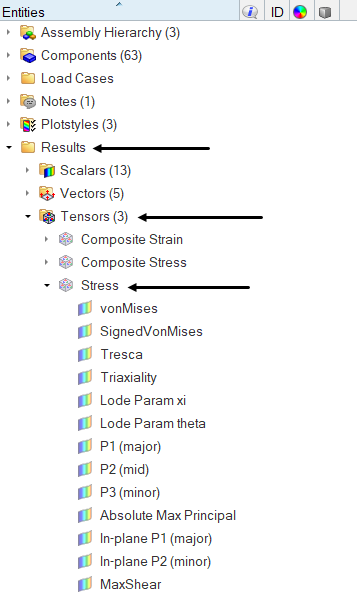 Figure 2.
 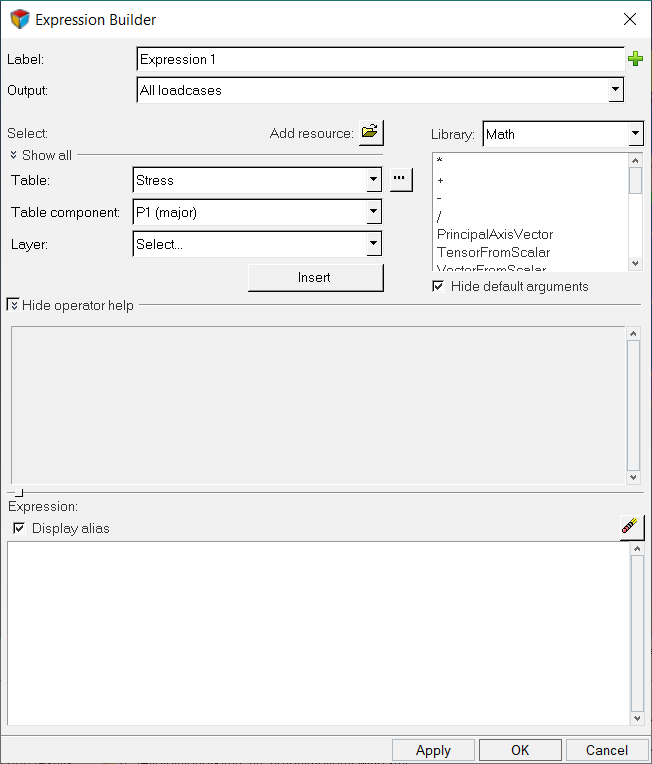 Figure 3. Note: In the Table and Table component fields, Stress and P1 (major) are already selected. This is because Derived Result was selected from a result in the Results Browser. If a result was not selected, or if the Derived Result Expression Builder was launched from the icon on the toolbar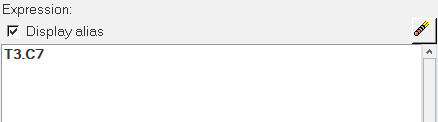
 icon to create another derived result.
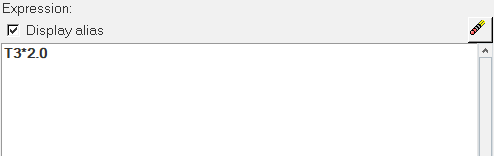 Figure 7.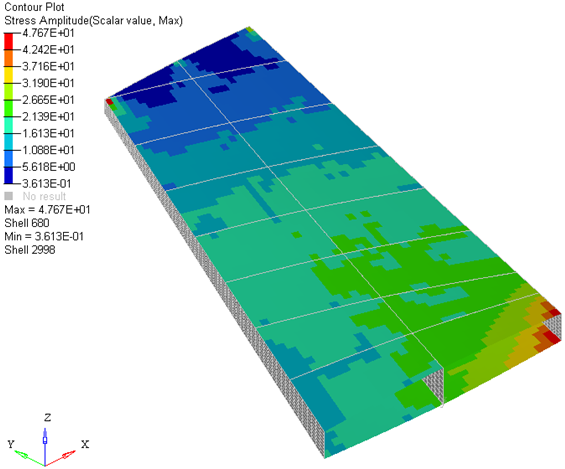
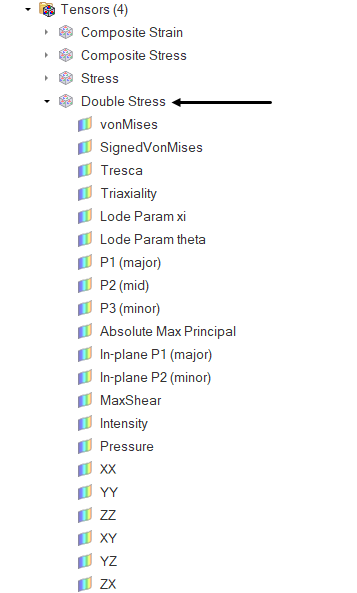 Figure 9.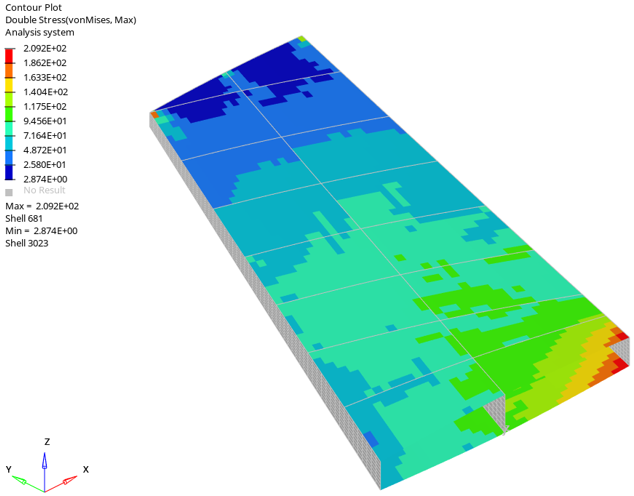
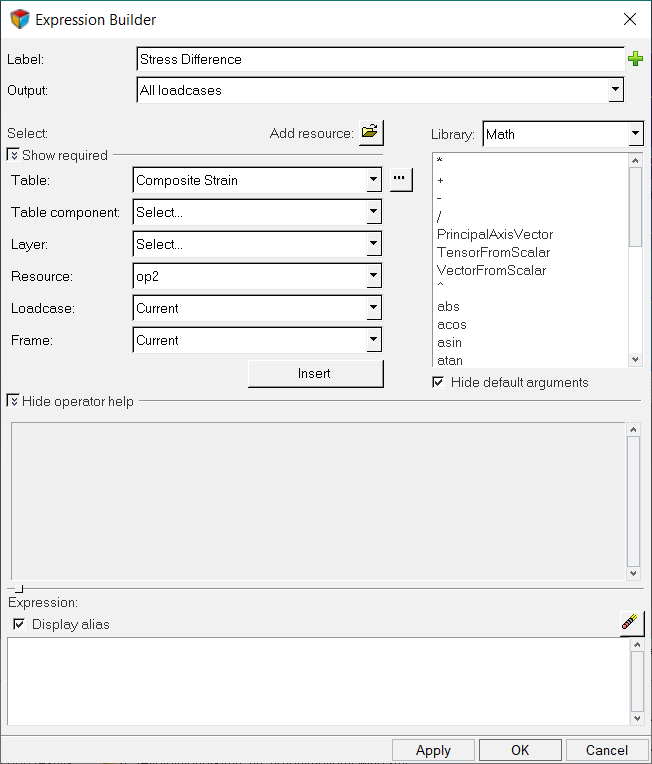 Figure 11.
 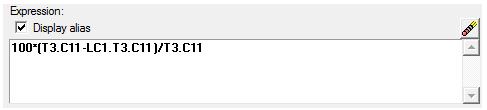 Figure 12.
 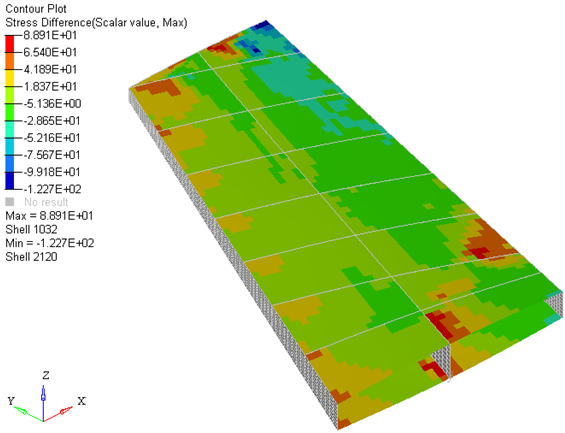 Figure 13.
 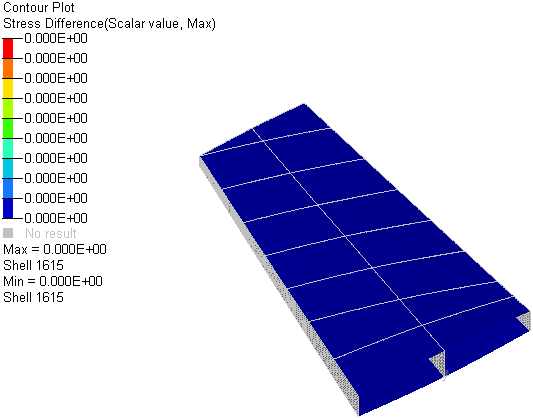 Figure 14. Note: All the values are zero. This is because the expression in the Stress Difference result subtracts the vonMises Stress from Subcase 1 from the Current Subcase, which in this case is also Subcase 1.