Review Results
Display results information from your analyses.
-
On the Analysis Workbench, click
 to expand the desired analysis branch.
-
Under the chosen branch, click Results.
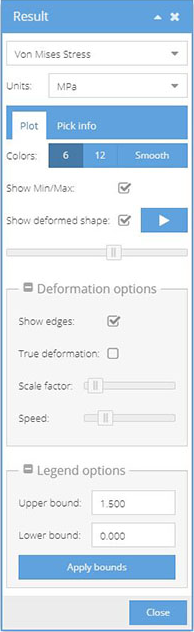
The Results window opens. This dialog has all controls necessary to plot and customize your results. You can specify the result quantity, and output units along with numerous contour visualization styles. You can plot your results contour on either the deformed or undeformed shape and you may animate the contour. You may query your contour to display maximum and minimum value locations as well as individual “pick info” labels.
Figure 1.