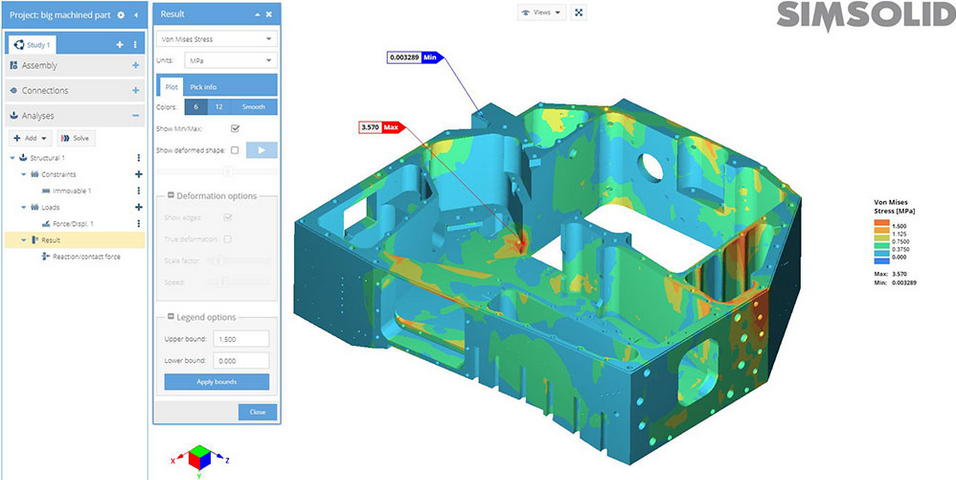
Overview of results displays available in SimSolid Cloud.
To plot a contour make sure the Plot tab is selected, then
simply pick a result type and units. The following additional displays are
available:
Show min/max – Displays the Max and Min labels on the model. The labels
remain fixed during model rotation but may be selected and dragged to
position them.
Show deformed shape – Shows the contour on an exaggerated deformed shape.
Pick the Animate button or drag the slider to manually see the deformed
model envelope.
Figure 1.
Deformation Options
Under the Deformation options section of the Plot tab, the following options are
available:
Show edges – shows the edges of the undeformed shape.
True deformation – by default, the deformed shape is scaled so that you may
more easily see them. Check this box if you want to turn this off.
Scale factor – this is the scale factor for the deformed shape. Drag to the
right to increase, to the left to reduce.
Speed – this is the speed of the deformed shape animation. Drag to the right
to speed it up and to the left to slow it down.
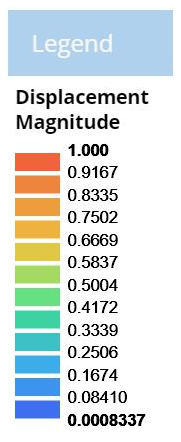
Legend Options
Under the Legend options section of the Plot tab, the following options are
available:
Upper bound & Lowerbound – adjust to scale the legend.
Apply bounds – select to update the legend. This is result quantity
dependent and is temporary. When a new quantity is selected or the result
dialog is closed these values are reset.
Lock the Legend - Set upper and lower bounds in the legend and lock them.
You can use this to retain the same bounds values when switching between
load cases.
You can drag the legend to any screen position by using the mouse to drag the
title bar.Figure 2.
Fast Result Switching
While results are displayed you may quickly switch to any other analysis by simply
picking their associative “Results” branch in the Project explorer. The same
visualization styles, animation, max/min or pick info values are displayed. This may
be in the same or different design studies. However, since geometry may be different
in each design study, pick info values remain in the analysis of the same study
only.
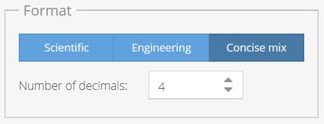
Customizing Numeric Formats
Under (Settings) > Units panel, you can set how numbers in the Results panel are
displayed.Figure 3. The following formats are available:
Scientific – This uses scientific notation. An example is: 1.2345e+3
Engineering –This uses standard numbers. An example is: 0.1234. Be careful
when using this format as very small numbers, such as displacements, may be
rounded to all zeros.
Concise Mix – this attempts to use Engineering format but switch to
Scientific when the scale is too small. This is usually the preferred method
to use.
 (Settings) > Units panel, you can set how numbers in the Results panel are
displayed.
(Settings) > Units panel, you can set how numbers in the Results panel are
displayed.