Mouse Over Notes
When you select Notes from the Plot Browser, you can activate a "mouse over", or Minimize, option from the Properties Table/Entity Editor.
When activated, curve-attached notes are represented in the plot by this icon, ![]() . The note
is visible when the mouse is moved or hovers over the icon, displaying the note and
its leader.
. The note
is visible when the mouse is moved or hovers over the icon, displaying the note and
its leader.
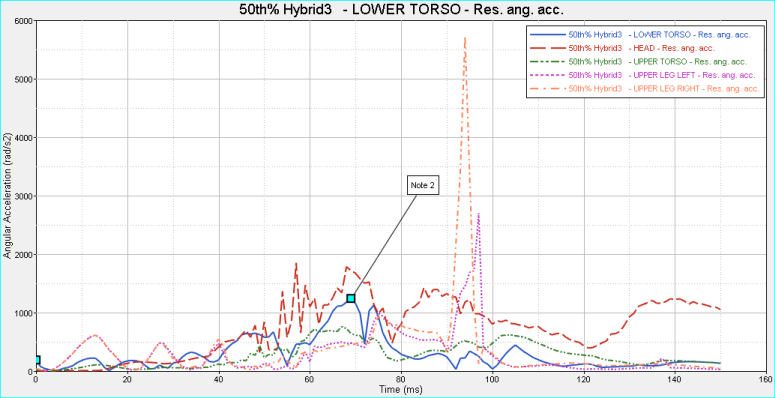
Figure 1.
When the mouse is moved away from the note, the icon is displayed again and the note disappears. This allows for greater flexibility over how notes are displayed, and makes plots with multiple notes easier to read. This option also ensures that the attachment points are not obscured for curve-attached notes. The location of the icon in the plot corresponds to the point on the curve to which the note is attached. The mouse over settings are done on a per-note basis, not as a general setting. If notes are in mouse over mode, or represented as an icon in the plot, the notes will be displayed that way in the published session.
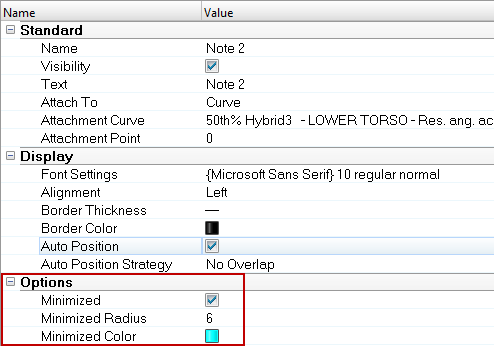
Figure 2. Mouse over notes options highlighted
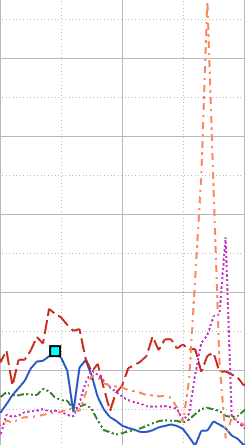
Figure 3. Curve with a minimized note, without the note text displayed (mouse is not hovered over the icon)
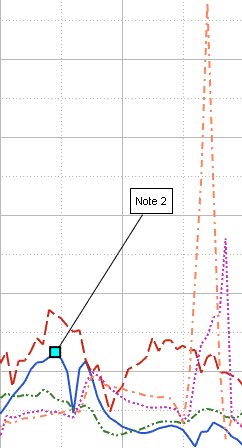
Figure 4. Curve with a minimized note, and the note text displayed
- Minimized
- When selected, notes are represented with an icon,
 . To view the note text, hover your mouse over the icon.
 - Minimized Radius
- Determines the icon's radius. To change the size, click in the field and enter a new value. Six is the default radius.
- Minimized Color
- Click on the box to view the color palette and change the icon's color.