Contour Panel
Use the Contour panel to create contour and assigned plots of your model, and view your analysis results, in either a contour or assigned plot mode.
Location: Post page
A contour plot allows you to see results represented as bands of color, based on the values returned from an analysis code. An assigned plot lets you see the values of each element by coloring the entire element, which provides an alternate way to view your analysis results. When you create a plot, default values are assigned to the colors in the legend. The legend subpanel allows you to redefine the colors in the legend of the plot.
In HyperMesh, values are located at either the nodes or the centroids of the elements. If you have results based on values at the nodes, the contour plot is created without averaging. An assigned plot can be created from nodal results, but the nodes are first averaged to create a value at the centroid of the element.
If you have values at the centroid of the elements, the assigned plot is created without averaging. A contour plot can be created if your results are based on values at the centroid, but the values must first be averaged. First, the nodes of the element are given the same value as the centroid of the element. Then the values at each node are added to the corresponding nodes of the neighboring elements. The sum of those nodes is then divided by the number of elements that contributed to the value at that node. The resulting value is assigned to the node at that point.
Contour Plot
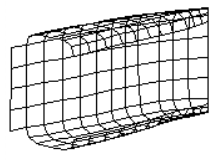 Figure 1. Model |
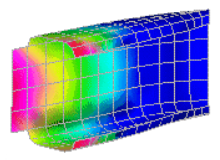 Figure 2. Contour Plot of Model |
Assigned Plot
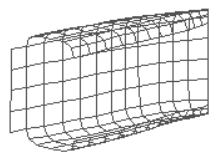 Figure 3. Model |
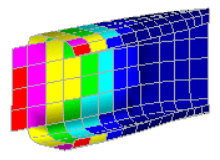 Figure 4. Assigned Plot of Model |
Params Subpanel
| Option | Action |
|---|---|
| simulation | Select a simulation type. |
| data type | Select a data type. |
| title | Enter a title for the plot. |
| magnitude / x, y, z comp | A component of displacement can be used by selecting x comp, y comp, or z comp. |
| undeformed / model units / scale factor | Mode of the assigned
plot.
|
| mult = | To multiply the values in the results file by a scale factor other than 1.0, enter a new scale factor. |
| min / max titles | Display the titles to the entities with the least and greatest
results values. For contour plots, the titles are attached to nodes. |
| info titles | Display an informational title in the modeling window. |
Legend Subpanel
| Option | Action |
|---|---|
| simulation | Select a simulation type. |
| data type | Select a data type. |
| title | Enter a title for the plot. |
| find maximum / maximum | The value to be assigned to the highest color in the plot. |
| find minimum / minimum | The value to be assigned to the lowest color in the plot. |
Cutting Subpanel
Once a plane has been activated, it can be moved through the model by picking the plane in the graphics area and dragging the mouse along the normal of the plane.
Planes can be trimmed and colored.
| Option | Action |
|---|---|
| simulation | Select a simulation type. |
| data type | Select a data type. |
| title | Enter a title for the plot. |
| xy, yz, xz plane | Select the desired plane(s) to use as a cutting surface. |
| trim planes | Masked the model so
that only the parts beyond the cutting plane display. Clear this checkbox to only display the plane. |
| reset planes | Reset the cutting planes to default values. |
| clip boundary elements | Cut the model flat
long the planar surface. Clear this checkbox to draw complete elements, often resulting in a bumpy surface. |
Isosurface Subpanel
Isosurfaces may be displayed based on the values contained within the legend or based on a single value.
- Move the mouse into the legend and select the pointer that appears after the color boxes.
- Hold the mouse button down and move the mouse to the desired location.
You may also set the value by using the menu item, iso surface =, or increment by using increment = and the add and sub menu items.
The color of the displayed isosurface can be the legend color or a constant user- selected value. See the menu item, legend color, while displaying a value-based isosurface.
While a value-based isosurface is displayed, you can choose to display the faces in the model that are above the isosurface value by selecting include faces above.
| Option | Action |
|---|---|
| simulation | Select a simulation type. |
| data type | Select a data type. |
| title | Enter a title for the plot. |
| value based / legend based |
|
| increment | Specify the amount to add or subtract from the selected values (which determine the displayed elements/nodes) when the add or sub buttons are clicked. |
| include faces above | Display elements/nodes with values equal to or above the selected value. |
| include faces below | Display elements/nodes with values equal to or below the selected value. |
Command Buttons
| Button | Action |
|---|---|
| contour | Create the contour. |
| prev / next | The prev or next which
is on the same line as the simulation changes only the
simulation. The prev or next which is on the same line as the
data type changes only the data type. If the simulation or data type is at the first position as found in the results file, selecting prev results in the simulation or data type being assigned to the last position in the file. If the simulation or data type is at the last position as found in the results file, selecting next results in the simulation or data type being assigned to the first position in the file. |
| assign | An assigned plot is element-based, creating the contour with lower resolution because each element has exactly one value. The default smooth contour averages element values at each node. |
| add | When a contour legend value is selected, this increases the value that it represents by the increment. |
| sub | When a contour legend value is selected, this decreases the value that it represents by the increment. |
| return | Exit the panel. |