Hide and View Overlaid Plots
You can hide and view the overlaid plots.
Another option to hide and view a plot is by clicking the plot file name in the legend. In this case, the plot is hidden from the plot view and is grayed out in the legend.
You can also hide and view a particular curve in a plot from its legend.
-
In the overlay panel, click
 beside the plot file
name that you wish to hide.
The plot and its legend details are hidden. The plot file icon changes to
beside the plot file
name that you wish to hide.
The plot and its legend details are hidden. The plot file icon changes to as shown:
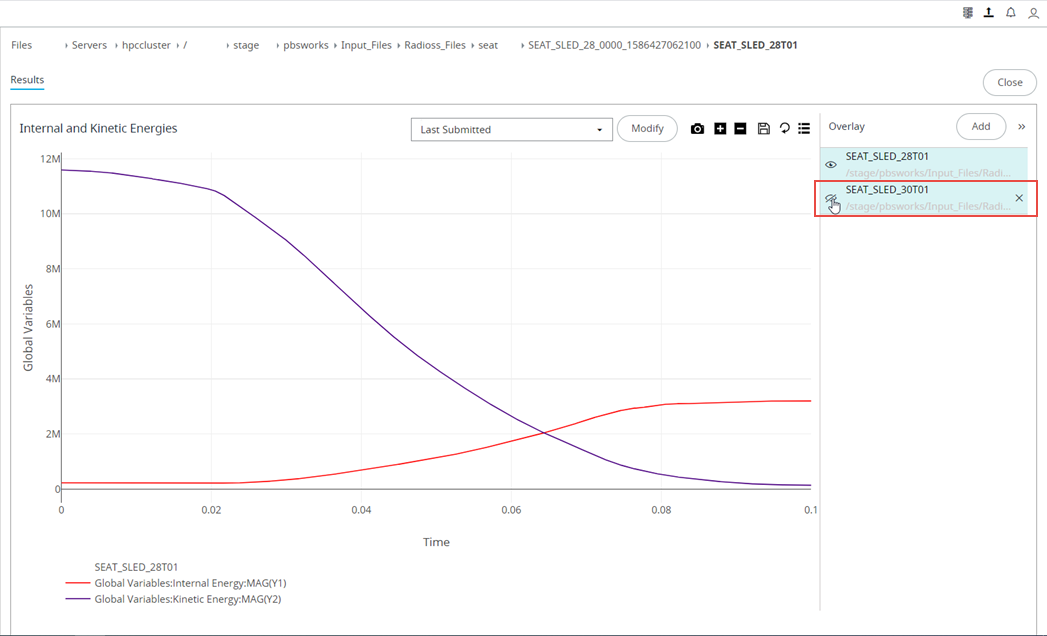
Figure 1. Plot HiddenTip: The hidden plot file icon tool tip changes to View. -
To view the hidden plot, click of the hidden plot
file.
The hidden plot along with its legend is visible in the plot area as shown:
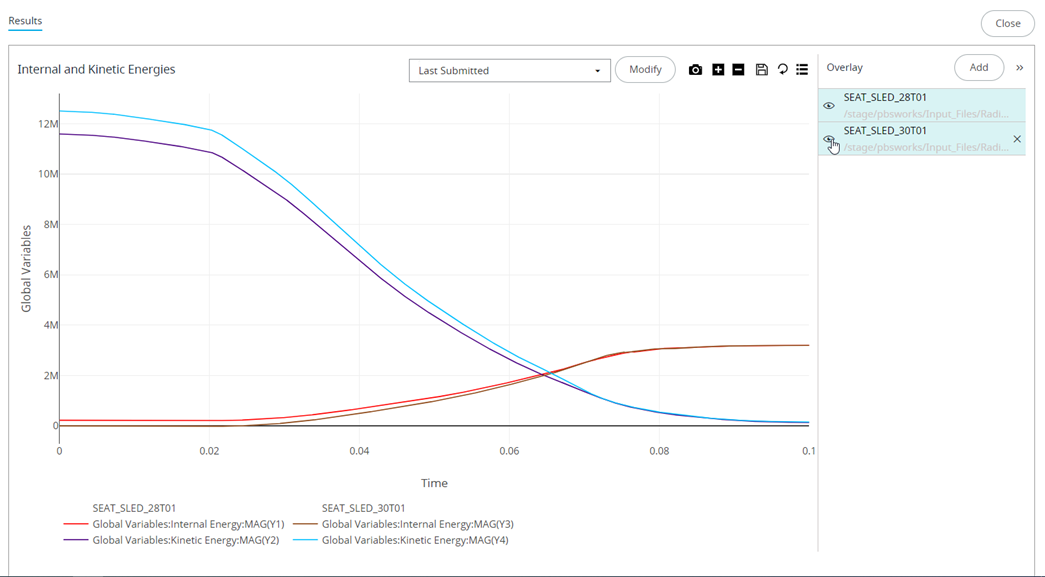
Figure 2. Viewing the hidden plot