Create a Plot from the Job Running Folder
A plot can be generated from a running job file. As the job progresses you can view the latest plot data of a running job.
While the job is running, the plot results are
auto-refreshed every one minute and is the default time interval. This interval can be modified
via the Preferences panel.
-
Click any of your running jobs from the Jobs tab.
The Running Folder is displayed.
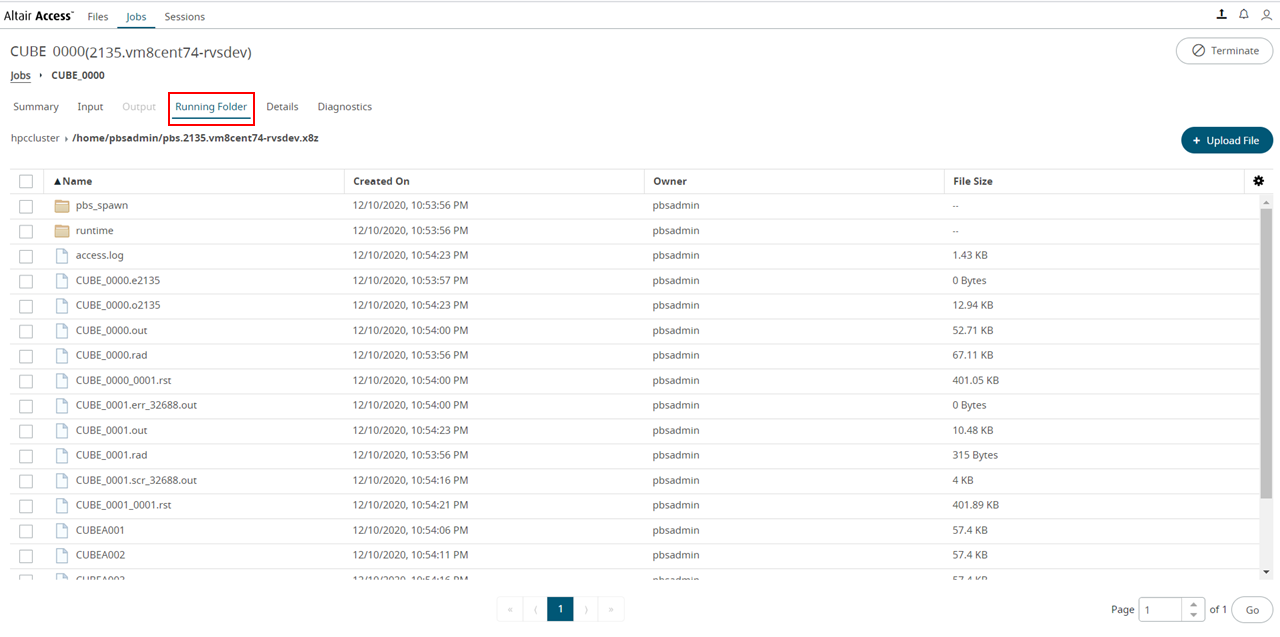
Figure 1. The Running Job Folder -
Right-click a plot file and then click .
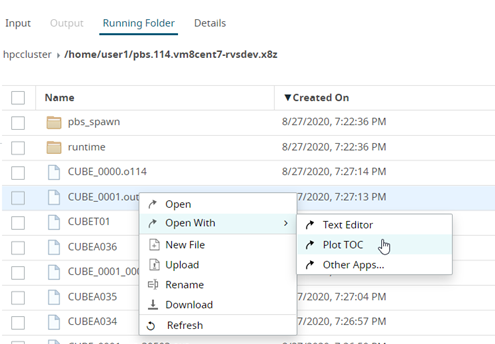
The plot Table of Contents (TOC) is displayed.
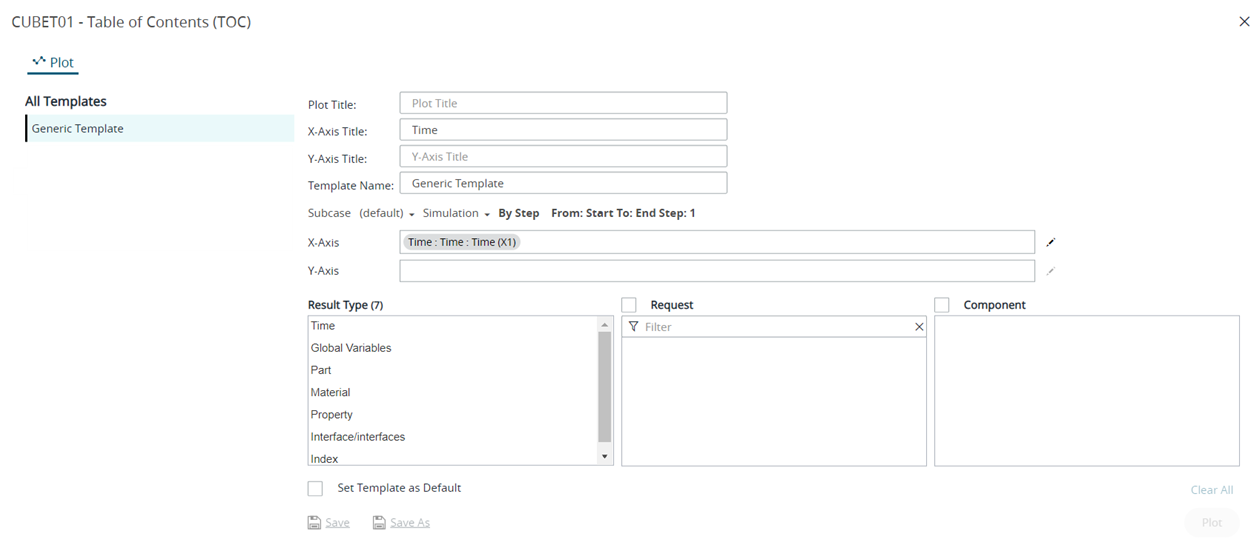
Figure 2. Table of Contents - Optional:
Click Simulation to select a simulation query.
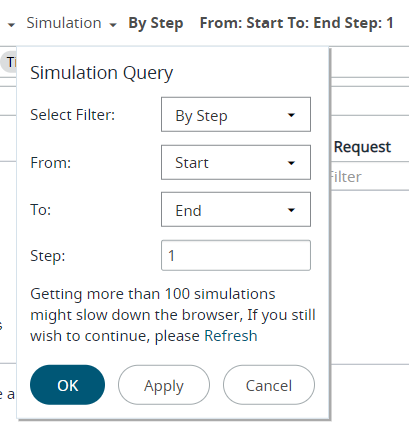
Figure 3. Plot Simulation Query Menu -
For X-Axis parameters, to choose different parameters click
 located to the right of the field.
Note: By default, the first entry in the result parameters list is considered for a plot.
located to the right of the field.
Note: By default, the first entry in the result parameters list is considered for a plot. -
For Y-Axis, select the required parameters from the Result
Type, Request and
Component sections.
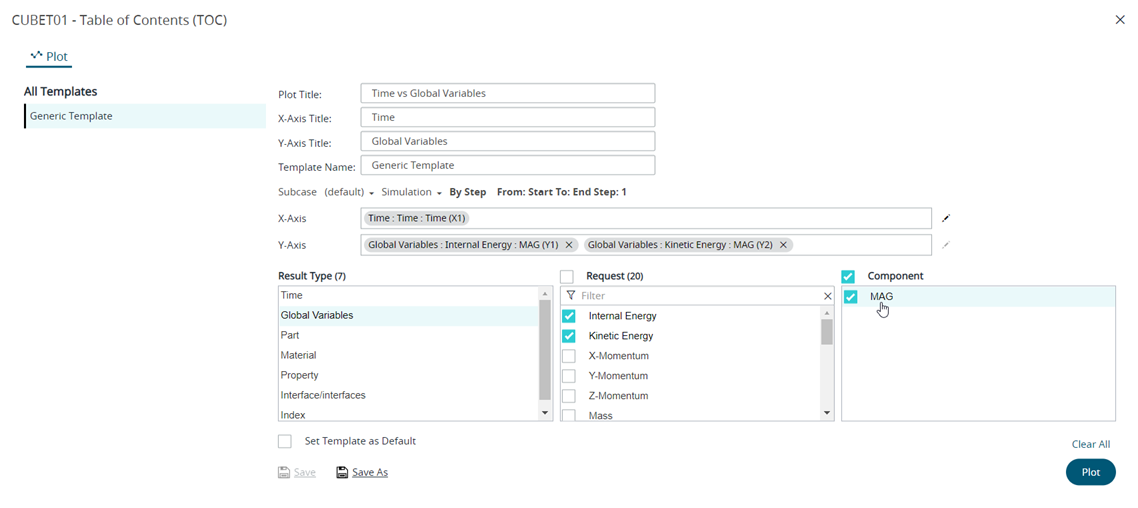 Figure 4. Select Plot ParametersThe selected components are added as X-axis and Y-axis variables.Tip: Click
 to clear the Y-axis selections.
-
Click Plot.
The plot is generated and displayed. The images here shows that the running job is being refreshed and displays the latest plot result files.
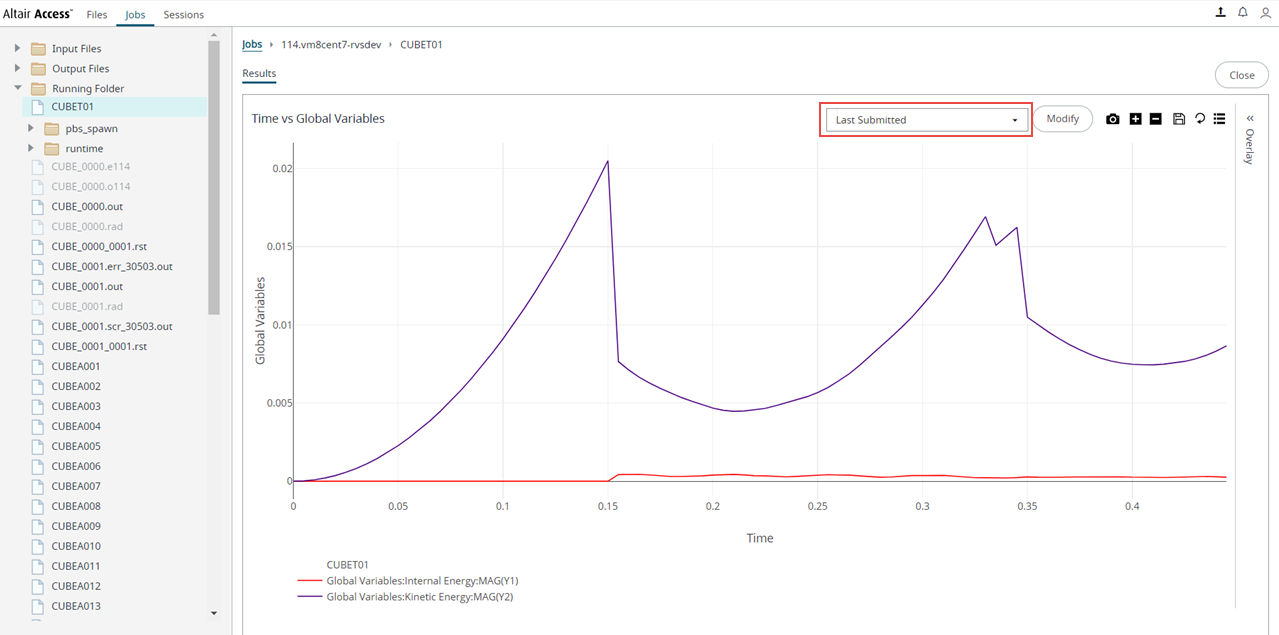
A message about refreshing the result file data is displayed.
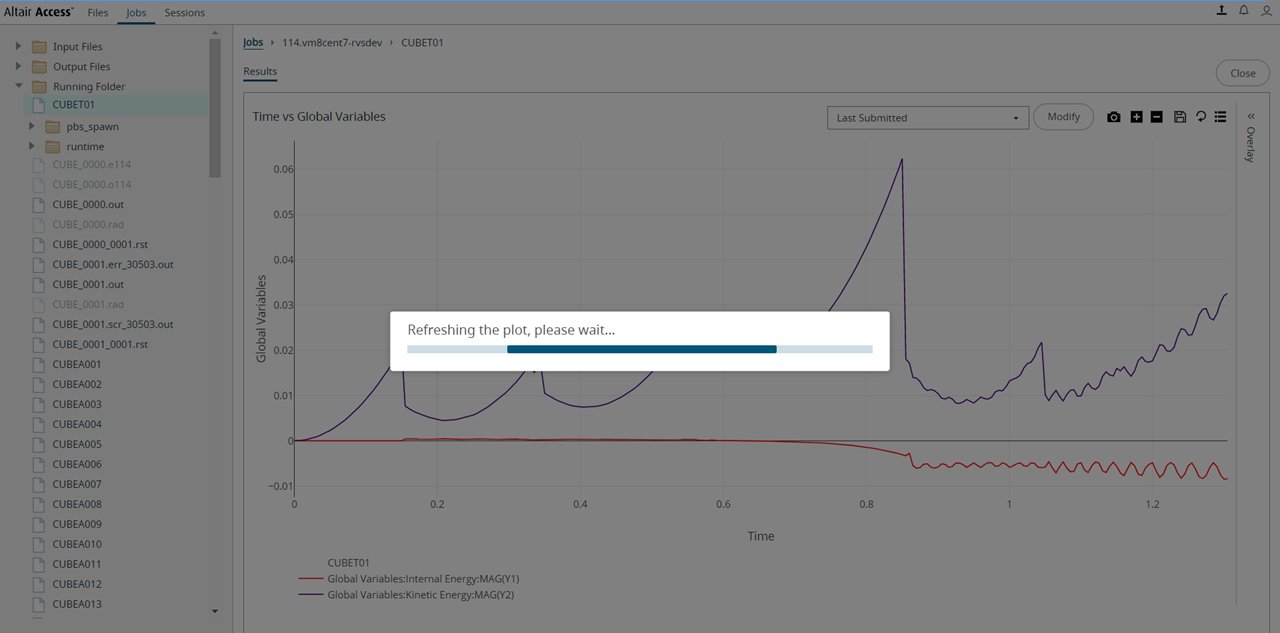
The plot is updated with the latest data.
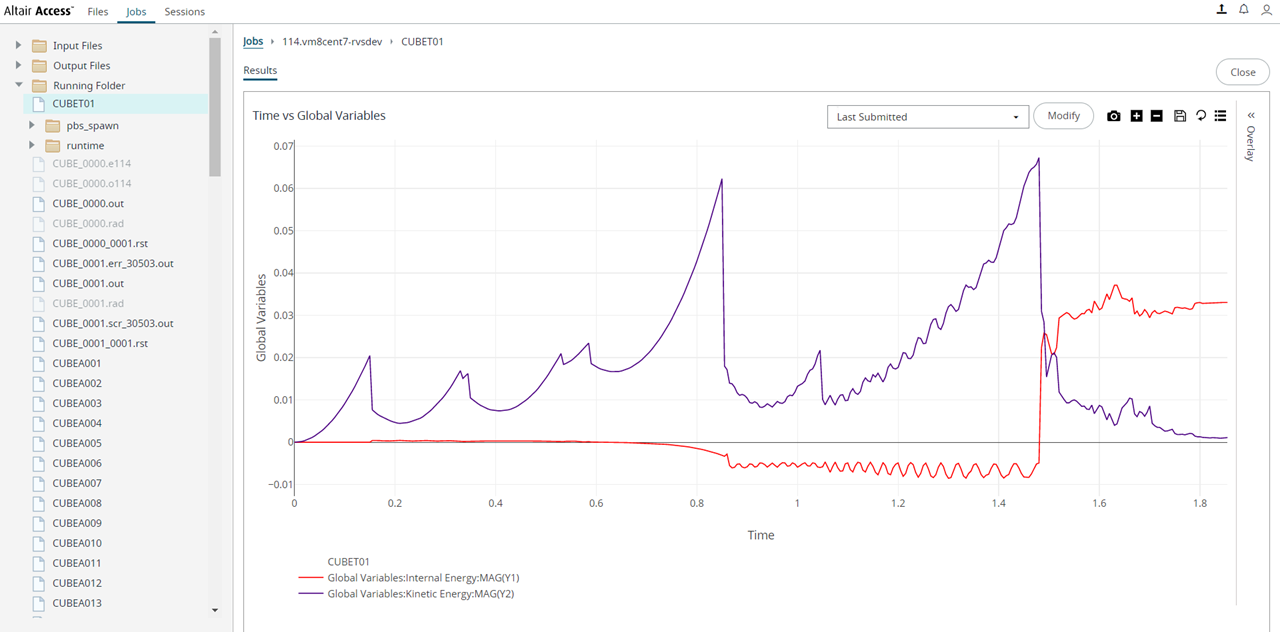
Figure 5. The Running Job Plot Result File DataTip: Click to return to the TOC to modify the plot
parameters.
to return to the TOC to modify the plot
parameters.