You can generate plots from the Job Summary tab for both running and completed
jobs.
From the Job Summary tab, you can select result files to visualize plots and
animations by selecting the parameters from the TOC. You can save the plot
parameters as templates, generate, save, export, and compare plots.
Plots which are generated for running jobs will automatically refresh at specified
time intervals. The default time interval, (one minute) can be set in the
Preferences panel.
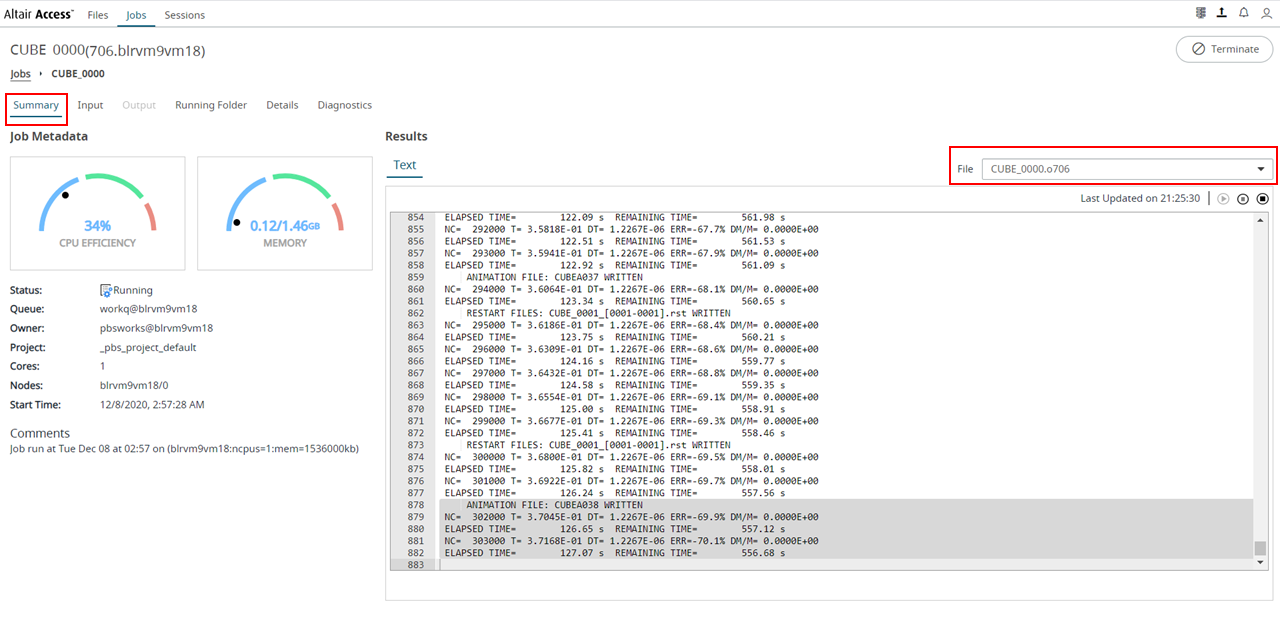
In the Jobs tab, click a job to view its summary.
The Summary tab is displayed. By default, the
contents of the job output file is displayed in the Text
viewer. Figure 1. Summary Tab
Select a result file from the File drop down list.
The contents of the result file is displayed in the
Text viewer and the Plot
viewer is displayed.
Click the Plot viewer.
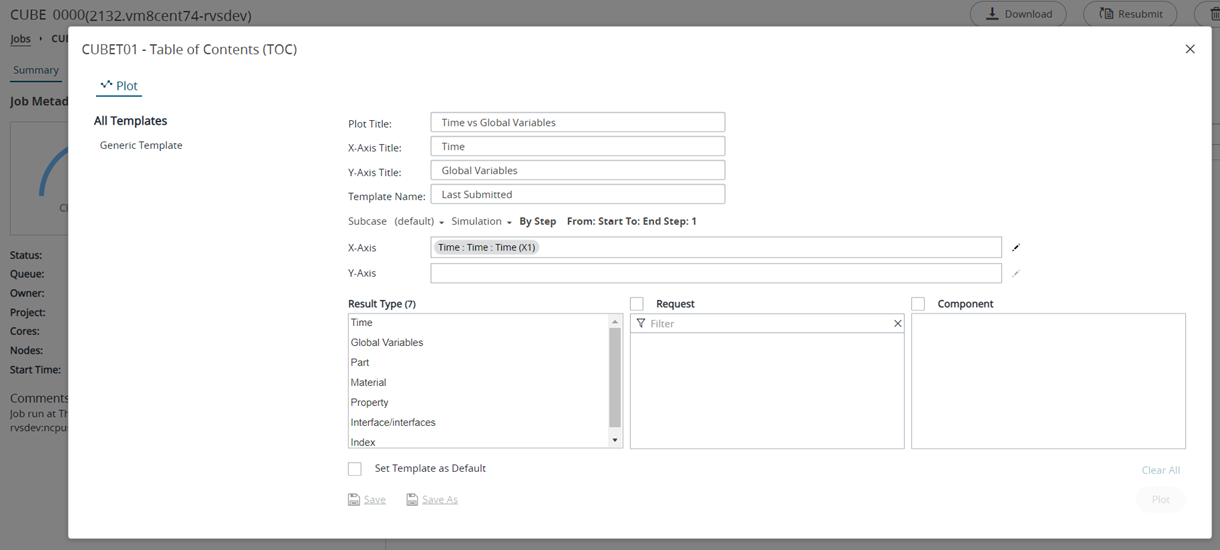
The plot TOC is displayed. Figure 2. Plot TOC
Optional: Enter a name for Plot Title.
Optional: Enter a name for X-Axis Title.
Optional: Enter a name for Y-Axis Title.
Optional: Enter a name for Template Name.
The first time you create a plot, the default values are displayed in the TOC.
If you change any parameters, click Generic Template to
reset their values.
Optional: Click Subcase and select the required load case.
Note: By default, the first entry in the subcase list is considered for a plot.
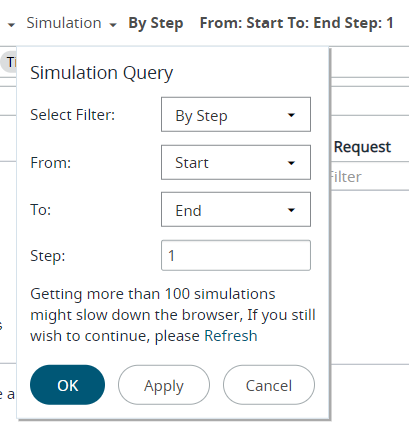
Optional: Click Simulation to select a simulation query.
Figure 3. Plot Simulation Query Menu
For Select Filter, select the appropriate filter.
For From, select the appropriate value.
For To, select the appropriate value.
For Step, select the appropriate value.
By default only 100 time steps are available for the view. Click
Refresh link, to view the complete list of
Time Steps.
Note: By default, all the listed simulations in the Simulation
Query is considered for a plot.
Click OK.
For X-Axis parameters, to choose different parameters click located to the right of the field.
Note: By default, the first entry in the result parameters list is considered
for a plot.
For Y-Axis, select the required parameters from the Result
Type, Request and
Component sections.
Figure 4. Select Plot Parameters
The selected components are added as X-axis
and Y-axis variables.
Tip: Click to clear the Y-axis selections.
Optional: Click Set Template as Default check box to set this template as a
default template. The next time you open result files of the same format, the
template will be applied and the plot will be automatically generated.
Click Plot.
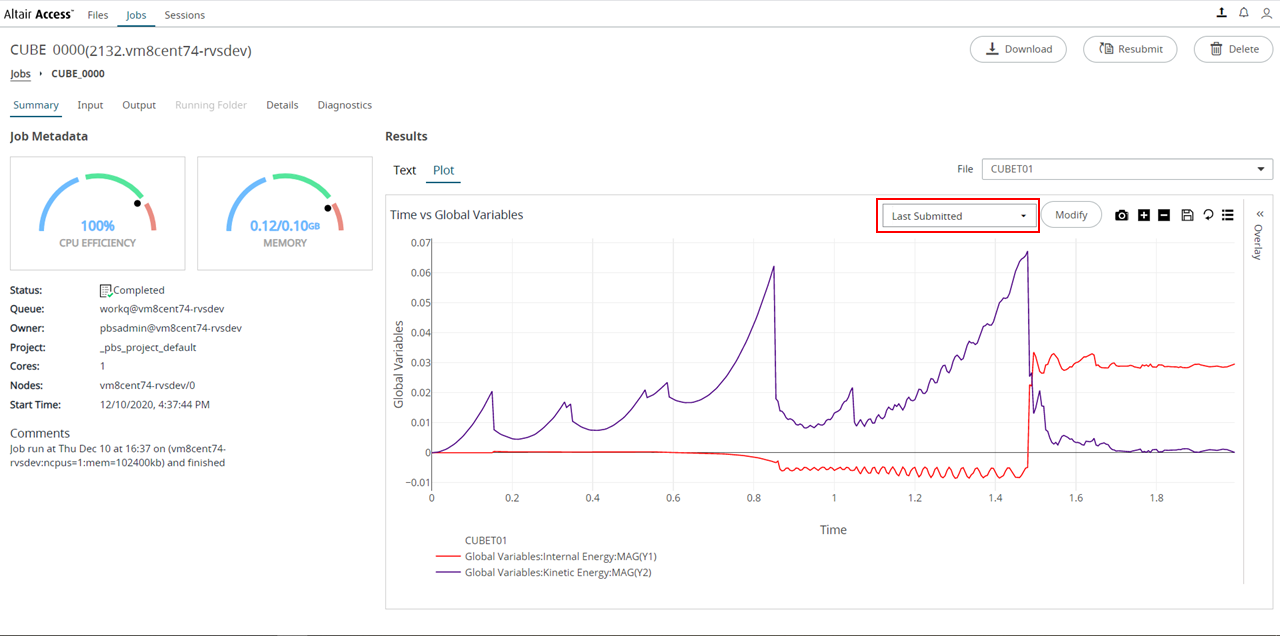
The plot result is displayed. Figure 5. Plot Result View
Tip: Click to return to the plot TOC to modify the
plot parameters.
Tip: Click the Last
Submitted drop down list to apply other
template.
 located to the right of the field.
Note: By default, the first entry in the result parameters list is considered for a plot.
located to the right of the field.
Note: By default, the first entry in the result parameters list is considered for a plot.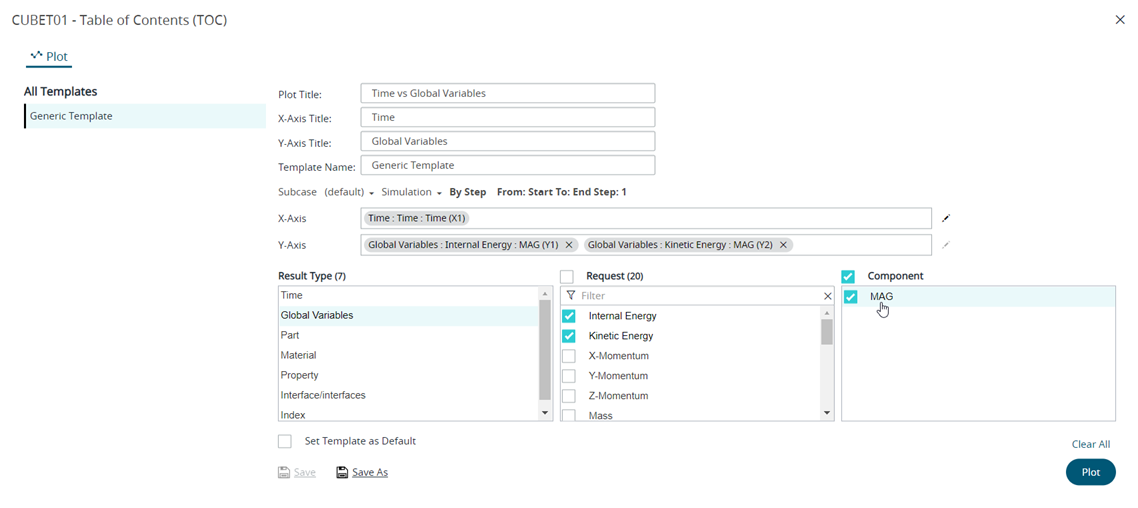 Figure 4. Select Plot ParametersThe selected components are added as X-axis and Y-axis variables.Tip: Click
 to clear the Y-axis selections.
 to return to the plot TOC to modify the
plot parameters.Tip: Click the Last Submitted drop down list to apply other template.
to return to the plot TOC to modify the
plot parameters.Tip: Click the Last Submitted drop down list to apply other template.