Create a Plot Template from Files Tab
Create a plot template, a customized shortcut to view plot results.
-
Right-click a plot file and then click .
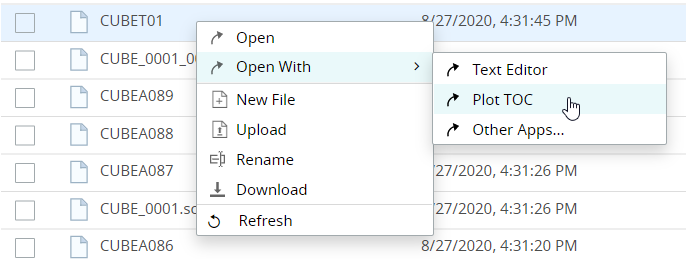
Figure 1. Plot TOC MenuThe Table of Contents (TOC) is displayed. - Optional:
Click Simulation to select a simulation query.
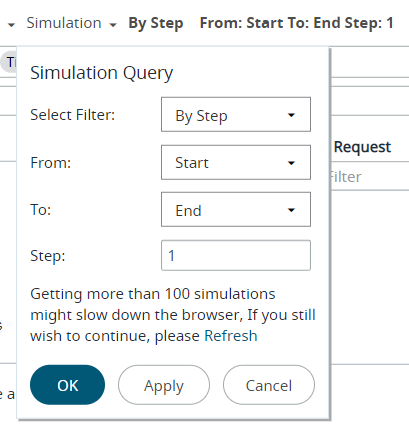
Figure 2. Plot Simulation Query Menu -
For X-Axis parameters, to choose different parameters click
 located to the right of the field.
Note: By default, the first entry in the result parameters list is considered for a plot.
located to the right of the field.
Note: By default, the first entry in the result parameters list is considered for a plot. -
Select the required parameters for Y-Axis from the Result
Type, Request and
Component sections.
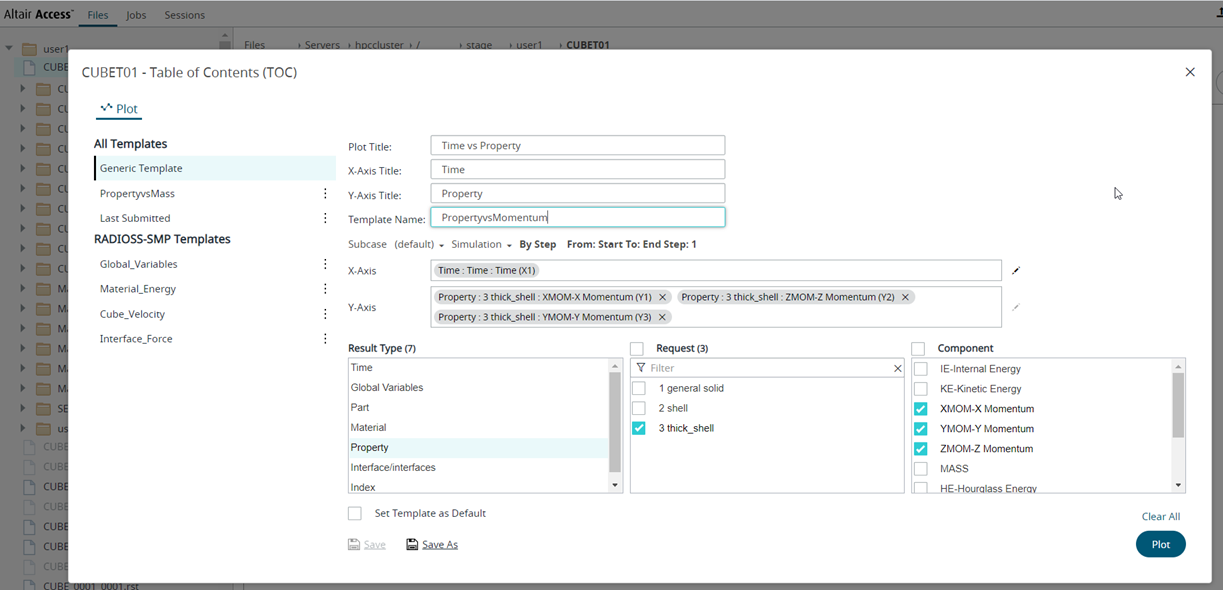 Figure 3. Select Plot ParametersThe selected components are added as X-axis and Y-axis variables.Note: Click
 to clear the Y-axis selections.
-
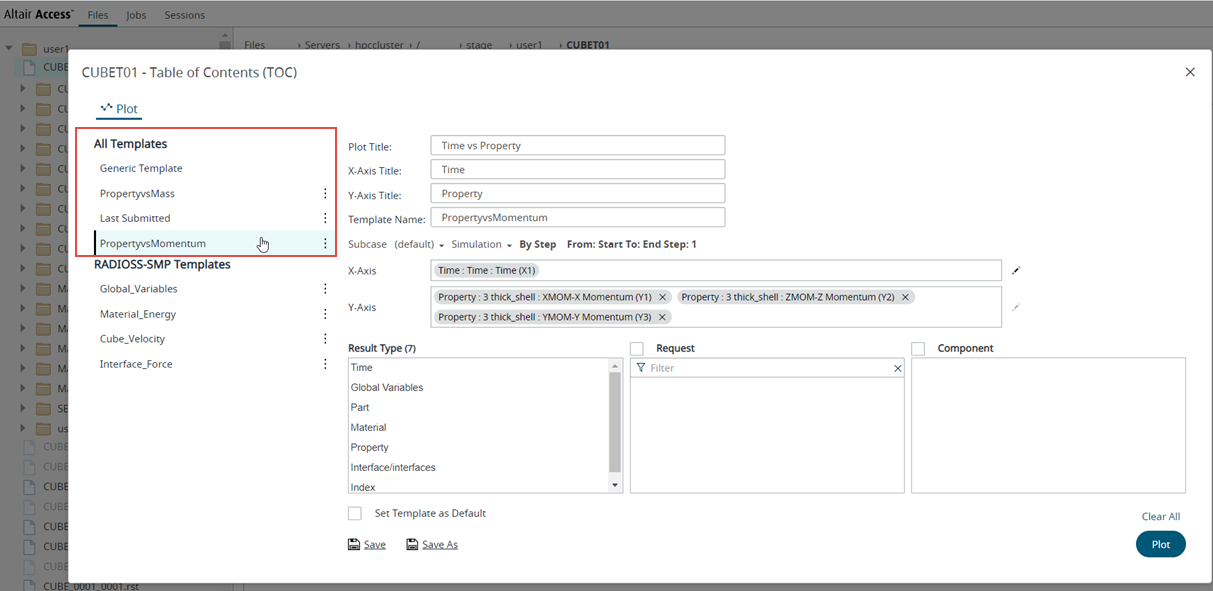
Click Save As to save the plot template.
In this example, The plot template: PropertyVsMomentum is categorized under All Templates since the plot result file is accessed from the Files tab and the result file doesn't have any solver information.The new plot template is displayed in the left pane.