Filter the HCP Resource Usage Charts
Filter the resource usage charts by HPC or by time period.
Filter the Resource Usage Charts by HPC
View core and node usage by a specific HPC or by all HPCs.
By default, core usage, job counts by state, and node usage information is displayed for all HPCs. Change the filter to view information for a specific HPC.
-
Click the HPC Cluster filter.
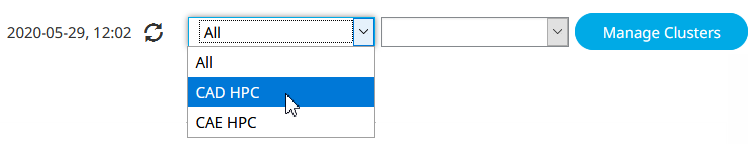
Figure 1. Filter by HPC
Filter the Resource Usage Charts by Time Period
View core and node usage by day, week, or month.
By default, charts are filtered by day. Change the filter to view information by week or by month.
-
Click the Time Period filter.
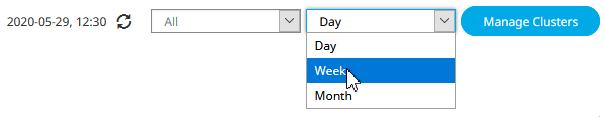
Figure 2. Filter by Time Period