View Chart Point Values
Display data values that have been assigned to a specific area of the chart.
Place your pointer over the chart.
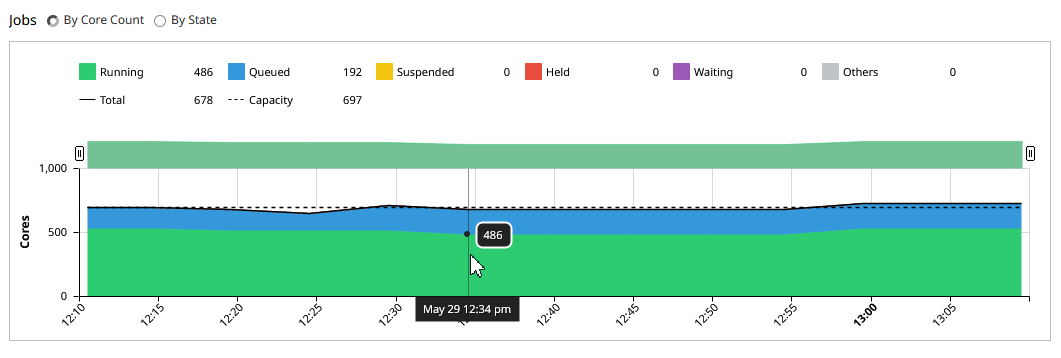
Figure 1. Display Data Point Values
Figure 1. Display Data Point Values
The corresponding chart values are displayed.