Sometimes the data displayed on a chart can become congested and difficult to
interpret. You can disable the display of groupings of chart data by clicking on the
chart legends.
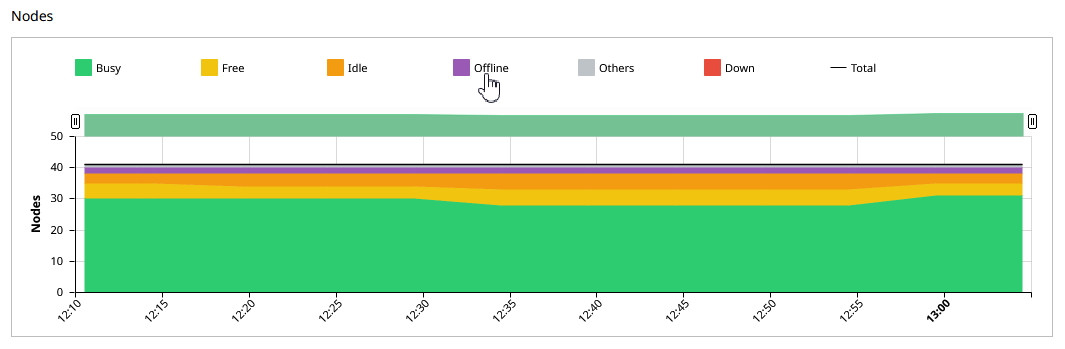
Click a chart legend.
Figure 1. Disable a Chart Legend
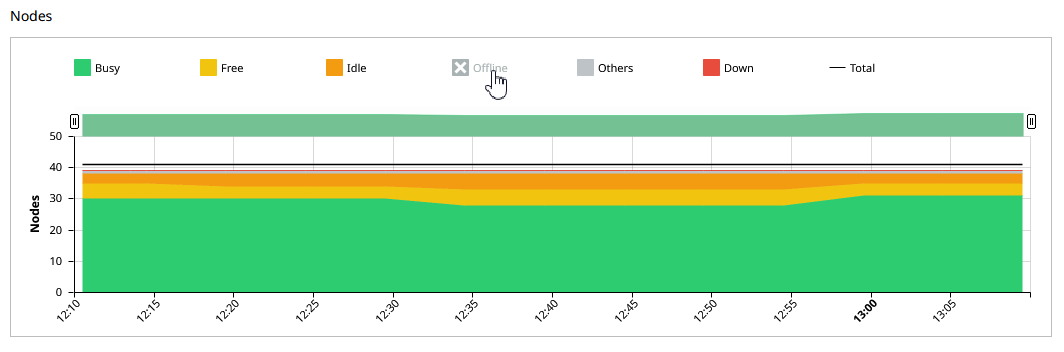
The data associated with the chart legend is no longer displayed in the
chart. Figure 2. Eliminate Chart Legend Data
Tip: To revert to the original display of data, click next to the chart legend that is
disabled.
 next to the chart legend that is
disabled.
next to the chart legend that is
disabled.